Download
1 / 44
450 likes | 821 Views
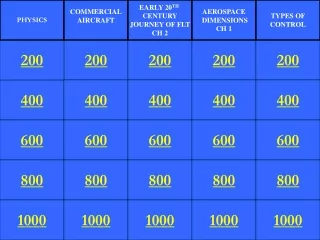
Color Vision and Colorimetry. 400. 500. 600. 700. violet blue green yellow orange red. Color names associated with monochromatic stimuli. Newton first discovered that the spectrum generated these colors by dispersing a white light (polychromatic) beam using a prism.

E N D
Color Vision and Colorimetry 400 500 600 700 violet blue green yellow orange red Color names associated with monochromatic stimuli Newton first discovered that the spectrum generated these colors by dispersing a white light (polychromatic) beam using a prism.
The importance of color. These two images are of the same scene, one in color and one only gray-scale. Notice how difficult it is to identify the (red) fruit without the color signal. Clearly color vision is essential for humans.
Part 1: The interrelationship between colorimetry (the science of quantifying color) and the trichromatic theory of human color vision. 1. Making color: Color mixing (additive & subtractive) 2. Trichromatic color theory (Maxwell’s color mixing experiments) 3. Color Space (RGB) 4. CIE color Space
Making Color: Color mixing (additive & subtractive) The way humans make color tells us a lot about how color is created within the human visual system 1. Additive Color Mixing: adding together different colored lights. 3 types of Additive Color Mixing A. Project different superimposed lights :added together in the stimulus. B. Spatially juxtapose different colored spots; added together by the eyes optics (“partitive” color mixing) C. Temporal addition: added together in the human neural system
A. Project different superimposed lights :added together in the stimulus (old style color TV projectors) Use 3 primaries: red, green and blue Primaries are colors that when added together allow one to produce many other colors. BLUE R+B = Magenta R+G = Yellow G+B = Cyan R+G+B = White B B+G R+B R+G+B G R R+G
B. Spatially juxtapose different colored spots: added together by the eyes optics (partitive color mixing) Sony Trinitron Most TVs, computer displays Used with TV, computers, and commercial printing (half-toning)
Optical blurring Blurred PSFs R+G+B By varying the relative intensity of the three spatially separate phosphor dots/lines, the spatially superimposed retinal image can be any combination of the three primaries (R+G+B)
Optical blurring Mixing Colors on a Computer screen Individual phosphor dots Color created by mixing primaries in retinal mage R, G and B primaries
“Pointilism” Surat (and later Monet) employed additive (partitive) color mixing, which was in direct contrast to earlier (and more recent) artists who created desired colors by subtractively mixing paints and dyes. Perceived color due to partitive color mixing of paint spots (points) and white canvas.
Example of Surat’s pointilism. In his picture, we see yellow cheeks, but he painted orange, blue and black spots with some white gaps between.
Using the eye of the observer to mix colors: the Art of Chuck Close Blurred Magnified
Each pixel is comprised of three color producing sub-pixel elements: one each for Red, Green, and Blue light The Generic Anatomy of a color LCD Pixel
New Color Technology: LCD Projector Anatomy High Intensity White Light Source (a Super Backlight!) Projection Optics Mirror Mirror Mirror Condenser Optics Red LCD Green LCD Blue LCD Transmissive Full Image Grayscale LCD Arrays Lens Lens Lens Mirror Mirror Dychroic Mirror (wavelength selective) Dychroic Mirror (wavelength selective)
V The optical principles of Liquid Crystal Projection Plane polarized light Unpolarized light Polarizing filter Liquid Crystal, voltage controlled cross-polarizer Demo: view LC watch or TV or projector with polarizing sunglasses. Can you determine the orientation of the device’s polarizing filter? Intensity modulated plane polarized light
Image courtesy of Texas Instruments New Color Technology 2: Digital Micromirror Projectors Digital Micromirrors • An array of digital micromirrors packaged in a single device a Digital Micromirror Device (DMD) • Digital images are created by reflecting a projection lamp off of the device
DLP Projector Anatomy High Intensity White Light Source Projection Optics Mirror Mirror Mirror Condenser Optics Selective Red Reflection Selective Blue Reflection Selective Green Reflection Mirror Mirror Dychroic Mirror Dychroic Mirror Light Trap Light Trap Light Trap Red DMD Green DMD Blue DMD
Example is the color wheel: place lots of different colored segments, but spin rapidly. Each retinal location then receives different colors in rapid succession. Due to neural temporal integration, the neural response to each color overlaps in time, and thus we see the addition of the neural response from each individual color. C. Temporal addition: added together in the human neural system Neural response Neural persistence Once a anachronistic demonstration, this phenomenon is now the basis for many of the newest high-tech digital projectors. All 3 responses occur (add) time
RGB color wheel You can tell if your projector uses three DMDs or one with a rotating color filter by saccading past the edge of the white screen. If it uses a filter the retinal image of the white edge will be separated into a red, green and blue edge.
2. Subtractive Color Mixing: Concept of a filter: Filters color light by absorbing some wavelengths more than others. Absorbing light is the same as subtracting it. Output = Input x Transmission absorb subtract transmit Transmission Spectrum of a red filter Transmission wavelength
Remember: Must choose primaries that, when mixed allow as many as possible colors to be produced. Subtractive primaries must be different from additive primaries. Example showing how cyan and yellow filters together produce green from white. Magenta (R+B) Cyan (B+G) B C Cyan M White Green Bk G R Y Subtract B Subtract R&Y Yellow (R+G)
Subtractive Color Mixing: Much more complicated that additive. This happens with inks and dyes. Light reflected from colored ink has been transmitted through minute ink particles of two primaries, similar to having two filters in series. White Green Layer of dye particles on surface of paper
When you purchase a color ink cartridge, it contains three color inks, the three primaries, from which all other colors are generated via subtractive color mixing. In this example, we see the box that contains a HP color cartridge. Notice that they show the three primaries (Yellow, Magenta, Cyan) overlapping to generate Red, Green and Blue.
400 500 600 700 wavelength (nm) Spectral description of mixing paints, pigments, dyes. Output spectrum = Input Spectrum x Bl x Yl White Blue reflectance absorption Yellow
Principle of Univariance: Once absorbed, each photon has the same effect, irrespective of its wavelength. Wavelength only influences the probability that a photon will be absorbed, not its effect once absorbed. Key Point: A single photoreceptor cannot differentiate between 440 (blue) and 640 (red) photon and therefore is totally wavelength-blind and thus color-blind.
Single Photoreceptor Retina: Monochromat Can create metameric match for any l by using only one primary (P) 10% P l 5% E.g. for one unit of l1, one unit of P will be a metamer, and thus for l2, a match will be achieved with 2 units of P Photon Efficiency P l1 l2 Wavelength
Single Photoreceptor Retina: Monochromat Appearance to Rod Monochromat 10% l P Property of Photoreceptor Photon Efficiency 5% l2 l1 Wavelength P Appearance to Trichromat l P Equal Radiance of primary and variable stimulus l Radiance Wavelength
Single Photoreceptor Retina: Monochromat Appearance to Rod Monochromat 10% l P Property of Photoreceptor Photon Efficiency 5% l2 l1 Wavelength P Adjust Radiance of primary to make perceptual match (metameric match) variable stimulus l Appearance to Trichromat l P Radiance Wavelength
Two Photoreceptor Retina: Dichromat Can create metameric match for any l by using only two primaries (P1 and P2) 10% P1 + P2 l 5% Photon Efficiency How many units of P1 and P2 will be required to match l1 and l2? 2.5% l2 l1 P1 P2 Wavelength
Three Photoreceptor Retina: Trichromat Can create metameric match for any l by using only three primaries (P1 , P2 and P3) P1 + P2 + P3 10% l 5% How many units of P1, P2 and P3 will be required to match l1? Photon Efficiency 2.5% l1 P1 P2 P3 Wavelength
2. Real color matching data and the Young-Helmholtz Trichromatic color theory (Maxwell’s color mixing experiments). Maxwell’s color Addition or Color Mixing experiments: evidence for Trichromatic color theory Example for l = 580 Monochromatic Yellow (580nm) Color matching paradigm R G B Mixture of R+G+B (approx equal R+G and zero B) Two stimuli appear identical. They are Metamers, this is a metameric match l
435 + 546 + 700 l Maxwell and others observed that all colors could be created by adding together R, G, and B lights in different proportions. That is ONLY 3 primaries were needed to match all possible colors. Conclusion!!! There must therefore be only 3 different photoreceptor types. Hence, the Trichromatic theory of human color vision. Color matching experiment. Identify metamers. Logic of a metamer: When two physically different stimuli create matching photon absorptions of the three photoreceptor types, the two stimuli will appear identical.
Quantification of color by quantifying the amount of three primaries necessary to create each color. That is, every color can now be defined by three numbers. This graph shows the amount of 3 primaries (R, G, & B) necessary to match every wavelength from 400 to 700. Called the RGB color matching functions, or tristimulus values rl, gl, bl.
For a given stimulus spectrum, we measure the amount of each primary R, G, and B to produce a match. These are the “Tristimulus values” for each color. The tristimulus values are then “normalized” to the sum of R,G, and B to create r, g, and b. r = R/(R+G+B) g = G/(R+G+B) b = B/(R+G+B) r + g + b = 1.0 R+G+B is a measure of the radiant intensity of the stimulus g r Thus, if know r and g, then MUST also know b. We plot g vs. r. This is known as the Chromaticity Diagram for the RGB system.
Problem with RGB chromaticity system: has negative tristimulus values for some wavelengths. Solved this by transforming RGB to new coordinates (XYZ). Same basic idea, but now the primaries are not real stimuli but only mathematical or “imaginary” primaries. The color matching (tristimulus) functions for the theoretical (“imaginary”) XYZ primaries used in CIE 1931
Radiance Wavelength (nm) Graph showing the amounts of X, Y, and Z primaries for each wavelength in the stimulus spectrum. The level of each primary is computed by multiplying the radiance by the tristimulus values for each primary. The total amount of each primary necessary to match this stimulus is the sum of all of the RadxPrimary values.
y x CIE 1931 For any given color, it can be matched by using appropriate amounts of XY&Z. x=X/(X+Y+Z) y=Y/(X+Y+Z) z=Z /(X+Y+Z) x+y+z = 1.0 Now plot y as a function of x. This is CIE 1931 chromaticity space, which is still the most widely used.
Shortcomings of CIE 1931. The ellipses represent the color discrimination thresholds in this CIE chromaticity pace (10x). Notice that they are not uniform in size, and very large in the top section. Who cares?? Notice also, that almost half of the space is taken up by green. Prompted search for “uniform” color space in which color jnd’s are circles.
CIE 1931 (XYZ) CIE 1976 (LUV) v’ u’ With new primaries (LUV) the non-uniform XY chromaticity space was replaced by the u’v’ chromaticity space. This new space is approximately perceptually uniform. The old CIE XYZ is still the most used system.
Alternate color specification system: Munsell Colors. Again, 3D space. Instead of XYZ, have hue (circumferential location), chroma (distance from center) and value (vertical position). Many color vision tests are specified in terms of Munsell Colors (e.g. D15 includes 15 colors with value of 5 and chroma of 4, and 15 different hues).
Valuable properties of CIE space: Easy to calculate additively mixed colors, and specify all colors produced by combining 3 “primaries” with additive mixing.
CIE 1931 Color diagram Possible colors produced by additive color mixing on TV and subtractive color mixing by dyes/inks.
Example #1: Mix equal amounts of monochromatic 510 and 560, result is color M (half way between 510 and 560). Color M has a dominant wavelength of 525 and an excitation purity of a/(a+b) = 0.75.
Example #2: Mix 3x as much 580 as 490, get color P. P has a dominant wavelength of 570, and a purity of 0.5.
Class Demo Experiment in class: Measure spectrum of colors, and plot in CIE space.