Download
1 / 18
180 likes | 602 Views
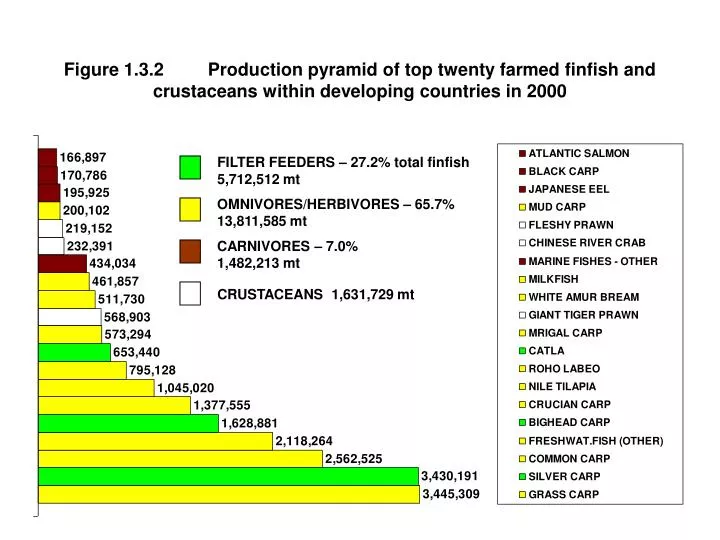
Figure 1.3.2 Production pyramid of top twenty farmed finfish and crustaceans within developing countries in 2000. FILTER FEEDERS – 27.2% total finfish 5,712,512 mt. OMNIVORES/HERBIVORES – 65.7% 13,811,585 mt. CARNIVORES – 7.0% 1,482,213 mt. CRUSTACEANS 1,631,729 mt.

E N D
Figure 1.3.2 Production pyramid of top twenty farmed finfish and crustaceans within developing countries in 2000 FILTER FEEDERS – 27.2% total finfish 5,712,512 mt OMNIVORES/HERBIVORES – 65.7% 13,811,585 mt CARNIVORES – 7.0% 1,482,213 mt CRUSTACEANS 1,631,729 mt
Figure 1.3.3 Production pyramid of top twenty farmed finfish & crustaceans within developed countries in 2000 FILTER FEEDERS – 2.4% 50,602 mt OMNIVORES/HERBIVORES – 23.7% 489,390 mt CARNIVORES – 73.8% 1,521,781 mt CRUSTACEANS 15,991 mt
Figure 1.2.10 Total finfish aquaculture production by major species groups in 2000(values expressed as % by weight) Total production 23,067,973 metric tons & valued at US $ 31,565,104,100 in 2000 FILTER FEEDING CYPRINIDS MARINE FISHES EELS MILKFISH SALMONIDS PELLET FEEDING CYPRINIDS CATFISHES TILAPIA OTHER FRESHWATER FISHES
Figure 1.2.11 Cyprinid aquaculture production 1970-2000(Total production and major Chinese carp species) Metric tons GROWTH APR (%/year) Change (%)70-80 80-90 90-00 70-00 99-00 Silver carp +5.1 +13.0 +8.6 +8.9 +2.0Grass carp +5.3 +21.1 +12.6 +12.8 +4.0Common carp +4.2 +12.0 +9.1 +8.4 +3.8Bighead carp +4.8 +11.3 +9.2 +9.0 +1.7Crucian carp +4.6 +21.3 +20.4 +15.2 +11.3Total cyprinids +5.6 +13.6 +10.8 +10.0 +4.7 15,707,109 mt
World Carp Production FAO statistics for 2001 • World --- 17 million tons. • China’s --- 12 million tons (70%)
The grasscarp (Ctenopharyngoden idella)
The common carp (Cyprinus carpio)
Figure 1.2.19 Production of farmed carnivorous and non-carnivorous finfish(values expressed in thousand metric tons - tmt, live weight equivalents) GROWTH (% APR) 1970-1980 1980-1990 1990-2000 1970-20001999-2000 Carnivores 11.0% 9.5% 10.6% 10.3% 7.5%Filter feeders 5.6% 12.7% 9.0% 9.1% 2.8%Omnivores/herbivores 5.9% 12.4% 10.8% 9.7% 8.1%Total finfish 6.4% 12.1% 10.3% 9.6% 6.7% tmt 1970 1980 1990 2000
Figure 1.3.5. Total aquaculture production in mainland China & the rest of the world GROWTHAPR (%/year) Change (%) 70-80 80-90 90-00 70-00 99-00 China, mainland +7.5 +11.6 +15.1 +11.3 +8.0 Rest of the world +7.4 +6.6 +4.1 +5.6 +2.5 Total world +7.5 +8.6 +10.5 +8.9 +6.3 45,715,559 mt 32,444,211 mt 71.0% 13,271,348 mt 29.0%
Figure 1.2.17 Finfish aquaculture production by feeding habit in 2000 (production by weight and by value) PRODUCTION BY FEEDING HABIT BY WEIGHT Total 23,068,083 mt PRODUCTION BY FEEDING HABIT BY VALUE Total US $ 31,565,104,100 OMNIVORES/HERBIVORES 14.30 mmt (62.0%) OMNIVORES/HERBIVORES US $ 15.63 billion (49.5%) FILTER FEEDERS US $ 5.12 billion (16.2%) FILTER FEEDERS 5.76 mmt (25.0%) CARNIVORES US $ 10.81 billion (34.3%) CARNIVORES 3.00 mmt (13.0%)
Figure 1.2.18 Finfish aquaculture production by feeding habit in 2000 (production by culture environment) PRODUCTION BY FEEDING HABIT CARNIVORES Total 3.00 mmt PRODUCTION BY FEEDING HABIT FILTER FEEDERS Total 5.76 mmt PRODUCTION BY FEEDING HABIT OMNIVORES/HERBIVORES Total 14.30 mmt FRESHWATER 5.76 mmt (100%) FRESHWATER 13.49 mmt (94.3%) MARICULTURE 2.00 mmt (66.5%) FRESHWATER 0.91 mmt (30.2%) BRACKISHWATER 0.10 mmt (3.3%) BRACKISHWATER 0.80 mmt (5.6%) MARICULTURE 10,712 mt (0.07%)
Major Disease Threats to Carp Industry • Spring Viremia of Carp (SVC) • Koi Herpes Virus (KHV)
Major Disease Threats to Carp Industry • Spring Viremia of Carp (SVC) • OIE listed • hosts: most carp species, goldfish, and some catfish species • rhabdovirus (ssRNA, enveloped, cytoplasmic replication) • acute hemorrhagic infections. • distribution: mostly Europe, but some recent outbreaks in Middle East and in North America.
Major Disease Threats to Carp Industry Koi Herpes Virus (KHV) • affects Koi & common carp. • Emerging disease (not yet OIE listed). • dsDNA, enveloped, intranuclear replication. • systemic infections with severe gill necrosis, excess mucus, petechial hemorrhages in skin & liver. • > 80% mortality typical when water is 18-27 C • major losses in Western Europe, Israel, USA (1998); Indonesia (2002), Japan (2003). • major threat to world carp production especially to China (70% of global carp production & major source of animal protein).