Download
1 / 34
340 likes | 539 Views
The Clean Trucks Program . CEE 587 Spring 2009. Marine Terminal Actors. Steamship lines (APL, Cosco) Terminal Operators (MTC, SSA) Port Authorities (Port of Seattle) County Governments (Pierce County Terminal) City Governments (City of Seattle, Seattle DOT, WSDOT) Security agencies (DHS)

E N D
The Clean Trucks Program CEE 587 Spring 2009
Marine Terminal Actors • Steamship lines (APL, Cosco) • Terminal Operators (MTC, SSA) • Port Authorities (Port of Seattle) • County Governments (Pierce County Terminal) • City Governments (City of Seattle, Seattle DOT, WSDOT) • Security agencies (DHS) • Drayage drivers and Licensed Motor Carriers • Importers or Shippers (WalMart) • Freight forwarders and expeditors • 3PLs or Logistics providers • Customs brokers • CBP • Labor Unions (ILWU, Teamsters) • Interest Groups (Waterfront Coallition) • EPA • Railroads Own objectives and remuneration or incentive schemes
Marine Terminal Issues • Environment • Air quality • Wetlands • Water quality • … • Security concerns • Competitiveness • Quality of life • Federalism Consideration at a system level
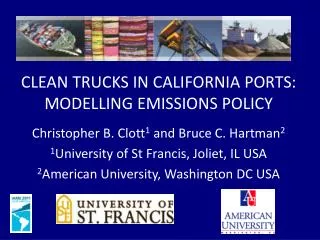
What is the Clean Trucks Program? • A proposal by the Ports of Los Angeles and Long Beach that would govern their relationships with Licensed Motor Carriers (LMCs) • LMCs will need to obtain a concession from the ports to do business there • LMCs must employ their drivers, currently most drayage drivers are owner/operators
What is the Clean Trucks Program? • Trucks will be charged a Transportation Impact Fee for every entry into the port ($34) if the truck does not meet 2007 Environmental Protection Agency regulations • Trucks will be required to have GPS units • Trucks will be required to have RFID tags • By 2012 all trucks will be required to meet 2007 EPA regulations
Official Goal of the CTP • With the program in place, the ports should be able to move forward with their infrastructure plans to expand to a capacity of 42.5 million TEUs while meeting the Clean Air Action Plan’s goals • Currently the ports moved about 16 million TEUs in 2006 • The Clean Air Action Plan will cut particulate matter (PM) pollution from all port-related sources by at least 47 percent within the next five years
Other Objectives • Transfer the burden of regulation from the ports to the LMCs (security, safety, environment) • Increase transportation system efficiency • Provide a mechanism for financing a technology investment at the port • Improve working conditions for drayage drivers (estimate improvement from $12/hour to $20/hour)
What is the threat? • Southern California will • Experience tighter environmental regulation • Lose it’s position as the main US Port of Entry for goods from Asia • Lose the associated jobs and economic activity • “By roughly 2025, that will result in the ability of the ports to support 300,000 to 600,000 new jobs that would be lost if that infrastructure cannot be built.” John Husing
Increasing the Size of Truck Fleets • Current fleets are small (70% less than 25 drivers) • Estimated 16,000 drayage trucks in operation • Number of concessions will be limited • Greater opportunities for operational efficiencies at the fleet level • Decouple the driver and truck, two shifts, spreading demand • Could reduce gate delay and terminal time if equal terminal resources provided across both shifts
Employee Drivers • Increases driver reliability? • Increase driver tenure/knowledge • Increased screening and background checks • Reduce driver turn-over • Reduce trouble transactions • Measured reduced wait time • Relationship between productivity and remuneration scheme • Seasonality
Magnitude of Trouble Transactions • Fewer trouble transactions due to familiarity with terminal operations • Average trouble time 18 minutes • 3% of total terminal time • Occur in between 5 and 10 % of all transactions
Gate Time Impacts • Automatic identification with RFID • Smoothing demand through use of 2 driver shifts • Increased driver retention • Security and labor concerns counter improvements from technology implementations • Reducing number of trips
Arrival Pattern • Perfectly uniform arrivals could completely eliminate gate delays • Additional benefit to the trucker through reduced terminal times • Better resource planning for terminal
Terminal Time Impacts • Fewer trouble transactions • Familiarity with terminal operations • Increased arrival rate into the terminal increases terminal time but decreases gate delay • Delays in the terminal are currently much more significant than delays at the gate
Truck Impact Fee • Additional incentive to reduce trips per container • Limited by current practice, fleet size and import/export balance • Matching at the destination: • Empty containers currently stored at the port • Matching at the port: • Bobtail in, wheeled container out can be combined with wheeled container in, bobtail out
Full container destination Full container origin Port
Full container destination Full container origin Port
Possible improvements from matching Estimated from regression model Current matching percentage For the terminal considered, an increase in matching trips by 15% (from 15 to 30%), the total turn time would be reduced by 2 minutes, about a 5% reduction in trip time.
Queueing System Stacks Gate Single versus double moves, wheeled versus stacked storage
Terminal Time Prediction R2 Could not correct for autocorrelation on wheeled imports
Known Drivers • Reductions in gate time due to an increased percentage of known drivers • MARSEC rules require a certain percentage of trucks to be positively identified under each MARSEC level
Gate time reductions with known vendors Estimated from queueing model
More benefit under high security Estimated from queueing model
Summary • The program itself does not require operational changes. • It provides some additional incentive to improve efficiency (truck fee, fleet efficiencies). • Implementation of the program may result in mild improvements through; • reduced gate delays, • fleet efficiencies, • increased driver tenure. • The possibility of disruption or inadequate truck or driver supply or the cost of the program to the industry is certainly increased. • The relationship between terminal time and operating parameters should be better understood • Improvements at the gate must be matched with improvements in the terminal • Terminal operations systems • Sensing infrastructure linked to operations management • The CTP creates an opportunity and 3% efficiency improvement could be achieved.
Recommendations • Coordination required between terminal operators and LMCs • Historically the relationship between ILWU (terminal employees) and drayage drivers (owner/operators) has been difficult • Mechanisms will be required to ensure cooperation if benefits are to be realized from technology investment • Consistent with other transportation developments • System benefit requires transfer of cost