Download
1 / 22
220 likes | 450 Views
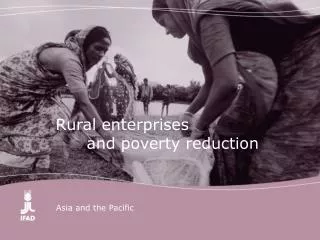
WASH in the East Asia and Pacific region. Key features of NSP services ... (drillers, well diggers, pipelayers, plumbers, mechanics electricians) ...

E N D
1. NON-STATE PROVISION OF WASH SERVICES IN EAST ASIA AND THE PACIFIC
Andy Robinson, UNICEF EAPRO Consultant The presentation is based on a review of Non-State Providers of WASH services in the East Asia and Pacific region (conducted by Andy Robinson). Review had a particular focus on informal providers and sanitation providers (as these areas were felt to be under-researched and represented in the literature).The presentation is based on a review of Non-State Providers of WASH services in the East Asia and Pacific region (conducted by Andy Robinson). Review had a particular focus on informal providers and sanitation providers (as these areas were felt to be under-researched and represented in the literature).
2. Content: WASH NSPs
WASH in the East Asia and Pacific region Key features of NSP services Key issues around NSP services Challenges to improving NSP services Success factors Presentation will examine: general features of WASH coverage in the region; key features and issues of NSP services; challenges and success factors. Presentation intends to set the stage for the group work that follows the presentations � the intention is to highlight some of the key issues and constraints, with a view to encouraging the participants to brainstorm on ways in which these issues and constraints can be addressed, and propose practical intervention options for governments and development partners in the region.Presentation will examine: general features of WASH coverage in the region; key features and issues of NSP services; challenges and success factors. Presentation intends to set the stage for the group work that follows the presentations � the intention is to highlight some of the key issues and constraints, with a view to encouraging the participants to brainstorm on ways in which these issues and constraints can be addressed, and propose practical intervention options for governments and development partners in the region.
3. Water Supply in the EAP region
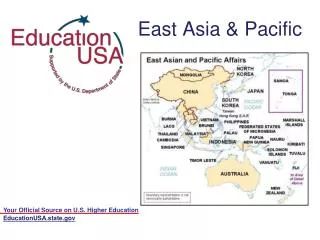
Improved water supply coverage (JMP 2008 data) Regional averages: 50% Oceania 86% South-eastern Asia 89% Eastern Asia High range across region: 0%-60% unimproved WS 6%-100% piped WS JMP averages for EAPRO region: 68% Piped water on premises (piped water supply) 20% Other improved water supply (non-networked) 12% Unimproved water supply National water supply coverage data highlight the dramatic differences across the region: 6% piped WS in Myanmar vs 83% piped WS in China! 43% unimproved WS in Lao PDR vs 6% in Vietnam Lowest coverage figures found among the more RURAL countries. However, also important to recognize that the JMP indicators of improved water supply are based on use of a particular supply type, with no allowance for: Time to collect water (distance to water point) Water quality (protected water sources may still provide contaminated water) Reliability of water supply (hours per day of supply; water scarcity in dry season; frequency of breakdowns) Water consumption (amount of water available; cost of water; time and labour constraints in fetching water) These additional factors mean that the proportion of people that benefit from improved drinking water supply on a consistent basis is lower than the JMP figures, particularly among poor households (who tend to use less reliable water supplies, face higher costs and consume less water). JMP averages for EAPRO region: 68% Piped water on premises (piped water supply) 20% Other improved water supply (non-networked) 12% Unimproved water supply National water supply coverage data highlight the dramatic differences across the region: 6% piped WS in Myanmar vs 83% piped WS in China! 43% unimproved WS in Lao PDR vs 6% in Vietnam Lowest coverage figures found among the more RURAL countries. However, also important to recognize that the JMP indicators of improved water supply are based on use of a particular supply type, with no allowance for: Time to collect water (distance to water point) Water quality (protected water sources may still provide contaminated water) Reliability of water supply (hours per day of supply; water scarcity in dry season; frequency of breakdowns) Water consumption (amount of water available; cost of water; time and labour constraints in fetching water) These additional factors mean that the proportion of people that benefit from improved drinking water supply on a consistent basis is lower than the JMP figures, particularly among poor households (who tend to use less reliable water supplies, face higher costs and consume less water).
4. Sanitation in the EAP region
Improved sanitation coverage (JMP 2008 data) Regional averages: 56% Eastern Asia 69% South-eastern Asia High range across region: 0%-64% open defecation 29%-100% improved san. JMP averages for EAPRO region: 60% improved sanitation 15% shared improved sanitation 18% unimproved sanitation 7% open defecation National sanitation coverage data highlight the dramatic differences across the region: 29% improved sanitation in Cambodia vs 81% in Myanmar High levels of shared (improved) sanitation in Mongolia, China and the Philippines. High levels of unimproved (unhygienic) sanitation facilities in PNG and China. Again, most rural countries show lowest coverage figures/ JMP sanitation progress indicators focus on use of particular types of household facilities, with no allowance for treatment and safe disposal of wastes and wastewater. These additional factors mean that the proportion of people that practice safe sanitation on a system-wide basis (i.e. from defecation to final disposal) is lower than the JMP figures, particularly among poor households (who tend to use less hygienic facilities, and often face more challenging treatment and disposal constraints). JMP averages for EAPRO region: 60% improved sanitation 15% shared improved sanitation 18% unimproved sanitation 7% open defecation National sanitation coverage data highlight the dramatic differences across the region: 29% improved sanitation in Cambodia vs 81% in Myanmar High levels of shared (improved) sanitation in Mongolia, China and the Philippines. High levels of unimproved (unhygienic) sanitation facilities in PNG and China. Again, most rural countries show lowest coverage figures/ JMP sanitation progress indicators focus on use of particular types of household facilities, with no allowance for treatment and safe disposal of wastes and wastewater. These additional factors mean that the proportion of people that practice safe sanitation on a system-wide basis (i.e. from defecation to final disposal) is lower than the JMP figures, particularly among poor households (who tend to use less hygienic facilities, and often face more challenging treatment and disposal constraints).
5. Equity in WASH services
Water supply Lower access by poor Much lower service quality (time to collect, contamination, reliability, consumption) Sanitation Much lower access by poor Higher disease and economic burdens from unsafe disposal Source: UNICEF (2009) Status and trends in drinking water and sanitation in East Asia and the Pacific Equity data from DHS and MICS surveys in five countries: Cambodia, Lao PDR, Mongolia, Thailand and Viet Nam. Equity data on WS does not show differences in access to piped water (which provides the greatest hygiene benefits due to higher availability of water): Cambodia CSES 2004: 1.6% piped water coverage among poorest quintile; 36% among richest. Equity sanitation data highlight that a significant proportion of non-poor households (25% in Q3 & Q4) practice open defecation. Therefore, interventions need to target both non-poor and poor households (with a range of options suitable to the different spending preferences and abilities of these groups).Equity data from DHS and MICS surveys in five countries: Cambodia, Lao PDR, Mongolia, Thailand and Viet Nam. Equity data on WS does not show differences in access to piped water (which provides the greatest hygiene benefits due to higher availability of water): Cambodia CSES 2004: 1.6% piped water coverage among poorest quintile; 36% among richest. Equity sanitation data highlight that a significant proportion of non-poor households (25% in Q3 & Q4) practice open defecation. Therefore, interventions need to target both non-poor and poor households (with a range of options suitable to the different spending preferences and abilities of these groups).
6. WASH: Non-State Providers
Following section attempts to map out the wide range of diverse services and providers involved in Non-State Provision of WASH services �Following section attempts to map out the wide range of diverse services and providers involved in Non-State Provision of WASH services �
7. Water Supply NSPs
Piped network operators (utility supply, independent source) Point source operators (kiosks, standposts, boreholes, handpumps, tanks, bottled water producers) Mobile distributors (tankers, trucks, carts, carriers) Support services (drillers, well diggers, pipelayers, plumbers, mechanics electricians) Manufacturers (pipes, pipe fittings, water meters, pumps, generators, water tanks, precast concrete goods) Broad range of services! We tend to think of public vs. private provision of network/piped water supply, but many people in urban areas are served by non-networked private providers (point sources and mobile); and many people in rural areas are served by systems operated by CBOs (perhaps provided by NGOs or FBOs). NGOs and CBOs are also active in the implementation of projects and in the construction of facilities. Finally, manufacturers and support service providers are often neglected � these providers are essential to cost-effective WASH services, but rarely receive much support or consideration.Broad range of services! We tend to think of public vs. private provision of network/piped water supply, but many people in urban areas are served by non-networked private providers (point sources and mobile); and many people in rural areas are served by systems operated by CBOs (perhaps provided by NGOs or FBOs). NGOs and CBOs are also active in the implementation of projects and in the construction of facilities. Finally, manufacturers and support service providers are often neglected � these providers are essential to cost-effective WASH services, but rarely receive much support or consideration.
8. Sanitation NSPs
Builders (latrines, sewer connections, septic tanks, soakaways, drains, toilet blocks) Mobile waste collectors (hand emptiers, mechanized systems, vacuum trucks, garbage trucks) System operators (sewer networks, treatment works, dumps, sanitary landfills, incinerators) Support services (marketing, hygiene promotion, community development) Manufacturers (latrine pans, pedestal toilets, washbasins, plastic tanks, pipes, potties, diapers, soap, detergents, precast concrete goods) Sanitation NSPs control an even larger proportion of the market than water NSPs. Few sanitation services are publicly provided in the EAP region, which leaves many people dependent on (largely) private provision. Of course, approximately 40% of the EAP population remains without access to improved sanitation, so the majority of poor households remain unserved. Sanitation NSPs control an even larger proportion of the market than water NSPs. Few sanitation services are publicly provided in the EAP region, which leaves many people dependent on (largely) private provision. Of course, approximately 40% of the EAP population remains without access to improved sanitation, so the majority of poor households remain unserved.
9. Who are the Non-State Providers?
This slide highlights the relevance of different categories of providers to the different sub-sectors. For simplicity, only the most common providers have been included (for instance, Faith-based organizations have been omitted, because these providers overlap significantly with NGO providers). It appears that (among NSPs) the private sector providers dominate in the provision of networked water services; that international providers have little role in waste management services); and that most non-networked and household sanitation services are delivered by informal, community or NGO providers. Broadly, urban services are provided by the those in the three top boxes, with informal private providers dominating among poor households; and rural services are provided by the three bottom boxes + informal private providers. While detailed data is unavailable, it seems likely that informal private provision is by far the largest category � particularly in the supply of services to poor households. This slide highlights the relevance of different categories of providers to the different sub-sectors. For simplicity, only the most common providers have been included (for instance, Faith-based organizations have been omitted, because these providers overlap significantly with NGO providers). It appears that (among NSPs) the private sector providers dominate in the provision of networked water services; that international providers have little role in waste management services); and that most non-networked and household sanitation services are delivered by informal, community or NGO providers. Broadly, urban services are provided by the those in the three top boxes, with informal private providers dominating among poor households; and rural services are provided by the three bottom boxes + informal private providers. While detailed data is unavailable, it seems likely that informal private provision is by far the largest category � particularly in the supply of services to poor households.
10. WS: Volume of NSP services
Small-scale water providers (World Bank, 2005) > 10% in Cambodia & Philippines > 30% in Vietnam > 50% in Indonesia Cambodia Small Towns Survey (BURGEAP, 2006) 17% paid for delivery by water vendors 3% connected to mini piped networks Metro Manila water supply (ADB, 2004) 30% using small-scale water providers (for some or all water) 50% urban poor households using small-scale providers Rural water supply in the Pacific (Willets et al, 2007) NGOs & FBOs providing primary water services in many areas (due to limited public and private capacity in remote island states) Data on the volume and significance of NSP services are limited. These data represent a summary of some of the more interesting and relevant studies available. A global World Bank study found that small-scale providers account for 10%-50% of water services in SE Asia. A Cambodian study confirmed that 20% of the population in small towns (data from a survey of 60 small towns) pay for water from private providers. Metro Manila studies by the ADB found that up to 30% use small-scale private water providers, rising to as high as 50% among poor households. Also clear that NGO and FBO services are more significant in low-capacity (public and private) environments such as the Pacific Island States.Data on the volume and significance of NSP services are limited. These data represent a summary of some of the more interesting and relevant studies available. A global World Bank study found that small-scale providers account for 10%-50% of water services in SE Asia. A Cambodian study confirmed that 20% of the population in small towns (data from a survey of 60 small towns) pay for water from private providers. Metro Manila studies by the ADB found that up to 30% use small-scale private water providers, rising to as high as 50% among poor households. Also clear that NGO and FBO services are more significant in low-capacity (public and private) environments such as the Pacific Island States.
11. SAN: Volume of NSP services
Higher proportion of NSP services than water supply Septic tank coverage in urban areas (AECOM, 2010) 40% in the Philippines 63% in Indonesia 77% in Vietnam Private provision of new rural latrines (various, 2007-09) 65% in Timor-Leste (lower due to small market and large UN & NGO presence) 87% in Cambodia 88% in Lao PDR Sanitation entrepreneurs (BPD, 2008) 10% sanitation treatment and disposal by private providers 70% sanitation transport by private providers 90% household facility provision by private providers 40%-80% septic tank coverage in SE Asia For sanitation: generally a higher proportion of NSP services than in water supply due to the household-based nature of many of the services (e.g. communal water supply more likely to be provided and managed by a public provider than a private household toilet). Evidence that private septic tank coverage already very high in URBAN AREAS of many EAP countries: 40%-80%. Almost all of these facilities are the result of private investments in services provided by informal local providers, representing a significant urban NSP market. Similar data exist in rural areas. Three studies of rural sanitation progress (in Cambodia, Lao PDR and Timor-Leste) found that 65%-90% of the new toilets (sanitation facilities) built over the last 6-8 years were the result of private provision (studies examined the growth in sanitation coverage evidenced by nationally-representative household surveys, and compared this growth in the national stock of rural household latrines against supply data from public and development partner programs to calculate the proportion of these new latrines likely to result from public (and DP-supported) provision, and assumed that the rest of the growth in coverage must be the result of self-provision through private providers). Finally, a BPD (Building Partnerships for Development in Water and Sanitation) study on sanitation entrepreneurs estimated that 90% of household facility provision is by private providers (which is in line with the rural sanitation data discussed above); that 70% of waste collection services are private; and that only 10% of sanitation treatment and disposal services are by private providers. For sanitation: generally a higher proportion of NSP services than in water supply due to the household-based nature of many of the services (e.g. communal water supply more likely to be provided and managed by a public provider than a private household toilet). Evidence that private septic tank coverage already very high in URBAN AREAS of many EAP countries: 40%-80%. Almost all of these facilities are the result of private investments in services provided by informal local providers, representing a significant urban NSP market. Similar data exist in rural areas. Three studies of rural sanitation progress (in Cambodia, Lao PDR and Timor-Leste) found that 65%-90% of the new toilets (sanitation facilities) built over the last 6-8 years were the result of private provision (studies examined the growth in sanitation coverage evidenced by nationally-representative household surveys, and compared this growth in the national stock of rural household latrines against supply data from public and development partner programs to calculate the proportion of these new latrines likely to result from public (and DP-supported) provision, and assumed that the rest of the growth in coverage must be the result of self-provision through private providers). Finally, a BPD (Building Partnerships for Development in Water and Sanitation) study on sanitation entrepreneurs estimated that 90% of household facility provision is by private providers (which is in line with the rural sanitation data discussed above); that 70% of waste collection services are private; and that only 10% of sanitation treatment and disposal services are by private providers.
12. Key NSP issues
The following sections attempts to highlight some of the key issues relevant to NSPs in WASH � Photo in the slide shows the situation in rural Cambodia following the Typhoon Ketsina in October 2009 (highlighting the accessibility and service provision problems faced by many EAP households).The following sections attempts to highlight some of the key issues relevant to NSPs in WASH � Photo in the slide shows the situation in rural Cambodia following the Typhoon Ketsina in October 2009 (highlighting the accessibility and service provision problems faced by many EAP households).
13. Lack of recognition or inclusion
NSPs often excluded from sector activities: Little recognition of the volume of NSP services Few alternatives to NSP services in many low-income communities (i.e. critical services; quality affects health) Significant capacity and resources in NSPs High household investment in NSP services (both non-poor and poor households) Failure to include NSPs in sector activities affects scale, cost-effectiveness and sustainability of interventions. Informal private providers rarely feature in sector planning, strategies, investment plans or programs. Informal providers are often seen as a temporary and inadequate solution rather than as partners, thus are frequently ignored in sector activities striving for improvement and progress. While international NGOs and national CSOs are becoming increasingly influential in sector discussions (particularly in the rural sub-sector), many local NGOs and CBOs struggle for voice or influence in decision-making or coordination bodies. This lack of recognition or inclusion ignores the volume of services provided by these NSPs, as well as the critical importance of NSP services to many low-income households. It is also short-sighted, because these NSPs contain significant capacity and resources, and receive substantial investments from households for private services. NSPs must be involved (in a more positive and supportive manner) in order to scale up coverage (by leveraging resources), improve cost-effectiveness (by recognizing comparative advantage and cost efficiencies), and increase sustainability (by providing incentives for the long-term local provision of services, and by encouraging local governments to facilitate NSP services). Informal private providers rarely feature in sector planning, strategies, investment plans or programs. Informal providers are often seen as a temporary and inadequate solution rather than as partners, thus are frequently ignored in sector activities striving for improvement and progress. While international NGOs and national CSOs are becoming increasingly influential in sector discussions (particularly in the rural sub-sector), many local NGOs and CBOs struggle for voice or influence in decision-making or coordination bodies. This lack of recognition or inclusion ignores the volume of services provided by these NSPs, as well as the critical importance of NSP services to many low-income households. It is also short-sighted, because these NSPs contain significant capacity and resources, and receive substantial investments from households for private services. NSPs must be involved (in a more positive and supportive manner) in order to scale up coverage (by leveraging resources), improve cost-effectiveness (by recognizing comparative advantage and cost efficiencies), and increase sustainability (by providing incentives for the long-term local provision of services, and by encouraging local governments to facilitate NSP services).
14. Affordability
Flexible and convenient services Low quality + high prices = high profit? Studies suggest that informal provider prices are often similar to public service prices (despite subsidies) � where competition exists. Received wisdom: Informal private providers exploit monopoly/oligopoly positions to over-charge for WASH services Lack of effective regulation (or monitoring) allows informal providers to provide low quality services for high prices Outcome = profiteering from low-income populations with few alternatives? Evidence from studies: 1. Informal providers in urban areas often face high costs (due to rising block tariffs, lack of bulk connections, high transport costs, difficult access, low consumption) 2. High levels of uncertainty, risk and rent seeking limit investments in service improvement, and encourage short-term strategies (with higher costs) Outcome = high costs result in high prices, but delivered through flexible and convenient services (that often match low-income demands) Surprisingly, most studies found that NSP prices and service quality is similar to those from public services (despite subsidies and support to public providers). Critical element is competition (to keep prices reasonable and encourage service improvements).Received wisdom: Informal private providers exploit monopoly/oligopoly positions to over-charge for WASH services Lack of effective regulation (or monitoring) allows informal providers to provide low quality services for high prices Outcome = profiteering from low-income populations with few alternatives? Evidence from studies: 1. Informal providers in urban areas often face high costs (due to rising block tariffs, lack of bulk connections, high transport costs, difficult access, low consumption) 2. High levels of uncertainty, risk and rent seeking limit investments in service improvement, and encourage short-term strategies (with higher costs) Outcome = high costs result in high prices, but delivered through flexible and convenient services (that often match low-income demands) Surprisingly, most studies found that NSP prices and service quality is similar to those from public services (despite subsidies and support to public providers). Critical element is competition (to keep prices reasonable and encourage service improvements).
15. Service quality
Assumption that NSP service quality is low? Independent network WS comparable to utility WS satisfaction surveys (e.g. Manila) find few differences between NSP and other services Competition important to service quality? Water quality issues among all providers? (evidenced by complementary use of bottled water) Sanitation: service quality problems Badly designed septic tanks and latrines Limited knowledge of key hygiene principles? As noted in the previous slide, most NSP studies have found that satisfaction is relatively high with small-scale water services. Where problems exist (e.g. in water quality), the public providers often face similar challenges (e.g. cost recovery sufficient to finance water treatment and reduce physical leakage)? Among network water providers, non-revenue water levels are frequently lower among NSPs than in public providers (due to newer systems, better local monitoring, and stronger incentives to control connections and limit losses). External assessments suggest that the quality of sanitation services is more problematic. Urban septic tanks are often under-sized with inadequate provision for safe disposal of effluent, or for regular emptying of the septage; similarly, rural pit latrines are rarely designed for easy cleaning, for fly-proofness, for protection from high water tables, or for sustainable usage when latrine pits fill (either through installation of a second pit, or through safe emptying and disposal of wastes). Unfortunately, the level of understanding (and interest) in what makes a hygienic latrine or septic tank, and of the correct procedures for the disposal of wastes, are low among almost all stakeholders (providers, regulators and users) � which means that there is little accountability or penalization when things are badly done. As noted in the previous slide, most NSP studies have found that satisfaction is relatively high with small-scale water services. Where problems exist (e.g. in water quality), the public providers often face similar challenges (e.g. cost recovery sufficient to finance water treatment and reduce physical leakage)? Among network water providers, non-revenue water levels are frequently lower among NSPs than in public providers (due to newer systems, better local monitoring, and stronger incentives to control connections and limit losses). External assessments suggest that the quality of sanitation services is more problematic. Urban septic tanks are often under-sized with inadequate provision for safe disposal of effluent, or for regular emptying of the septage; similarly, rural pit latrines are rarely designed for easy cleaning, for fly-proofness, for protection from high water tables, or for sustainable usage when latrine pits fill (either through installation of a second pit, or through safe emptying and disposal of wastes). Unfortunately, the level of understanding (and interest) in what makes a hygienic latrine or septic tank, and of the correct procedures for the disposal of wastes, are low among almost all stakeholders (providers, regulators and users) � which means that there is little accountability or penalization when things are badly done.
16. Public finance
Bulk of WASH public finance to non-poor? Utility water and sanitation subsidies (non-poor urban) Household latrine subsidies (non-poor rural) Septage management finance (non-poor urban, commercial) Ideology that expanding utility and CBO supply will (eventually) reach the poor � but a slow process in practice? Inadequate targeting (reliance on processes influenced by local political economy) Little public finance to support NSP services Public finance in urban areas is largely to utility services, treatment facilities and, in some cases, to programs to provide public toilets and water points. The majority of this public finance benefits non-poor households (who use most of the utility water supply; and comprise the majority of sewer and septic tank connections) and commercial/industrial users. In rural areas, sanitation programs aim to subsidize latrines for poor households. In practice, evaluations often find that the majority of the subsidy has been captured by non-poor households (due to subjective targeting criteria that allow allocation through local power structures, over-designed sanitation facilities that are attractive to the non-poor, and cost-sharing rules that exclude the poorest). More explicit and objective targeting is needed (plus measurement of targeting effectiveness); and more public finance should be directed towards support of NSP services. Public finance in urban areas is largely to utility services, treatment facilities and, in some cases, to programs to provide public toilets and water points. The majority of this public finance benefits non-poor households (who use most of the utility water supply; and comprise the majority of sewer and septic tank connections) and commercial/industrial users. In rural areas, sanitation programs aim to subsidize latrines for poor households. In practice, evaluations often find that the majority of the subsidy has been captured by non-poor households (due to subjective targeting criteria that allow allocation through local power structures, over-designed sanitation facilities that are attractive to the non-poor, and cost-sharing rules that exclude the poorest). More explicit and objective targeting is needed (plus measurement of targeting effectiveness); and more public finance should be directed towards support of NSP services.
17. Policy alignment
NGOs, FBOs, CSOs, CBOs: Independent objectives, policies and constituencies Limited coordination and co-implementation (risk of undermining other provider interventions) Little sharing of resources and capacity Sustainability issues (linked to finance & objectives) Private sector (formal and informal): Prohibition ineffective (enforcement limited) Few incentives or support mechanisms NSPs rarely align their policies, approaches and projects with those of the public sector. NGO and civil society organizations value their independence, and find it easier to work without the hindrance of local government. But this limits collaboration, and leads to sustainability issues (as few of these organizations have sustainable financing or staffing, or are able to provide long-term support to all of the communities that they work with). Private providers offer a more sustainable form of service provision, but may lack incentives to follow public policies. In the past, governments have often resorted to regulation and prohibition to control private service provision, but these approaches are of limited effectiveness among informal providers. The main outcome of strong regulation and/or prohibition is often to increase costs and risks, which then results in higher prices for poor customers. NSPs rarely align their policies, approaches and projects with those of the public sector. NGO and civil society organizations value their independence, and find it easier to work without the hindrance of local government. But this limits collaboration, and leads to sustainability issues (as few of these organizations have sustainable financing or staffing, or are able to provide long-term support to all of the communities that they work with). Private providers offer a more sustainable form of service provision, but may lack incentives to follow public policies. In the past, governments have often resorted to regulation and prohibition to control private service provision, but these approaches are of limited effectiveness among informal providers. The main outcome of strong regulation and/or prohibition is often to increase costs and risks, which then results in higher prices for poor customers.
18. Challenges to improved NSP services
High uncertainty and risk(asset seizure, corruption, rent seeking, lack of protection) Vested interests (public providers, politicians, profiteers) Administrative, legal and financial barriers (tenure, paperwork, fees, registration) Ineffective regulation(limited capacity, resources or authority for enforcement) Vested interests: wishing to preserve the status quo (subsidies to particular providers; or high prices paid by substantial populations). An example from Karachi, Pakistan, where the military (Rangers) took over control of the bulk supply to water tankers from the utility following armed menaces to tanker drivers and utility staff. The Rangers introduced strict regulation of tanker filling stations and tanker registration, and started charging higher filling prices. Tanker supplies were previously used to expand utility services to low-income areas as a social service, but became a commercial service that directed more water to non-poor areas (able to pay high prices for tanker water). The Rangers kept the water tanker income as payment for their supervision of the services, and (at the time of a case study in 2005) were reluctant to relinquish control of this income-generating role. An example of vested interests (tanker companies, military chiefs and non-poor households) influencing policy to limit pro-poor services. Informal providers often lack the formal registration, licensing, tenure and personal paperwork required to meet government requirements. High administrative and financial barriers encourage illegal activities and avoidance. Vested interests: wishing to preserve the status quo (subsidies to particular providers; or high prices paid by substantial populations). An example from Karachi, Pakistan, where the military (Rangers) took over control of the bulk supply to water tankers from the utility following armed menaces to tanker drivers and utility staff. The Rangers introduced strict regulation of tanker filling stations and tanker registration, and started charging higher filling prices. Tanker supplies were previously used to expand utility services to low-income areas as a social service, but became a commercial service that directed more water to non-poor areas (able to pay high prices for tanker water). The Rangers kept the water tanker income as payment for their supervision of the services, and (at the time of a case study in 2005) were reluctant to relinquish control of this income-generating role. An example of vested interests (tanker companies, military chiefs and non-poor households) influencing policy to limit pro-poor services. Informal providers often lack the formal registration, licensing, tenure and personal paperwork required to meet government requirements. High administrative and financial barriers encourage illegal activities and avoidance.
19. Success factors (1)
Information (service mapping, evidence of costs of inaction, identification of high-risk areas) Pro-poor units and funds (explicit objectives, specialist skills, performance incentives) Asset protection and investment guarantees (for competent providers) Political support (high-level advocacy, evidence of investment benefits, outcome-based incentives) Phased approach (recognize capacity & resource constraints; willingness to pay; scale requirements) And �. Information is critical. Data on NSP services is often inadequate. Better mapping of services; better identification of high-risk, problem or under-served areas; and better evaluation of the public costs associated with inadequate services (e.g. health and pollution control costs caused by inadequate sanitation and hygiene; productive time lost due to collecting water, inadequate sanitation, and related sickness) are needed to inform financial and resource allocations. Few stakeholders have sufficientincentive or specialist skills to provide services in low-income areas. And few stakeholders monitor what happens in these areas. Lessons learned in East Africa and South Asia suggest that local governments (and utilities) need to establish pro-poor units and poverty funds with explicit pro-poor objectives, clear performance targets and incentives, and the specialist skills needed to work with informal providers and low-income households under challenging conditions. Politicians need to be convinced that interventions can work (successful local models required); that low-cost approaches are available; and that local outcomes will be easily verifiable. A phased approach is often more effective: allowing capacity and resource allocations to grow in line with demand creation and improvements in the supply of services.Information is critical. Data on NSP services is often inadequate. Better mapping of services; better identification of high-risk, problem or under-served areas; and better evaluation of the public costs associated with inadequate services (e.g. health and pollution control costs caused by inadequate sanitation and hygiene; productive time lost due to collecting water, inadequate sanitation, and related sickness) are needed to inform financial and resource allocations. Few stakeholders have sufficientincentive or specialist skills to provide services in low-income areas. And few stakeholders monitor what happens in these areas. Lessons learned in East Africa and South Asia suggest that local governments (and utilities) need to establish pro-poor units and poverty funds with explicit pro-poor objectives, clear performance targets and incentives, and the specialist skills needed to work with informal providers and low-income households under challenging conditions. Politicians need to be convinced that interventions can work (successful local models required); that low-cost approaches are available; and that local outcomes will be easily verifiable. A phased approach is often more effective: allowing capacity and resource allocations to grow in line with demand creation and improvements in the supply of services.
20. Success factors (2)
Appropriate finance (demand-side, performance-based, objective targeting, and enabling environment) Effective regulation (encourage registration and self-regulation through incentives & social accountability) Professional support services (business development, capacity building, access to credit) Partnerships (local government facilitation + NGO skills + private sector efficiency) More appropriate finance is required: Demand-side finance = finance that encourages people to invest in sustainable local services (rather than finance of temporary project supply chains). Examples include a shift towards latrine vouchers for poor households (to be redeemed with trained and accredited local service providers) which allow user choice and encourage local innovation, rather than the provision of standardized technologies through inefficient public supply chains. Finance is also needed for improvements in the enabling environment, such as better targeting systems, and more performance and outcome-based programs. More appropriate finance is required: Demand-side finance = finance that encourages people to invest in sustainable local services (rather than finance of temporary project supply chains). Examples include a shift towards latrine vouchers for poor households (to be redeemed with trained and accredited local service providers) which allow user choice and encourage local innovation, rather than the provision of standardized technologies through inefficient public supply chains. Finance is also needed for improvements in the enabling environment, such as better targeting systems, and more performance and outcome-based programs.
21. In Summary
Non-State Providers = diverse + complex group Important services (with potential for more) Enabling environments inadequate (for NSPs) NSPs hard to monitor and regulate Need a more incentive and performance-based framework (rather than regulations and penalties) NSPs are a diverse group covering many different types of provider and service. The review confirms that NSPs provide important services to a large proportion of the EAP population. Current enabling environments are inadequate. NSPs are often mentioned in policies, but implementation of these policies is limited, and support to NSPs is rarely a significant feature of sector programs and investment plans. Informal service providers are particularly hard to monitor, regulate and penalize. In general, more success has been achieved through supportive, incentive and performance-based frameworks that encourage better and more pro-poor services than through prohibition and penalization. NSPs are a diverse group covering many different types of provider and service. The review confirms that NSPs provide important services to a large proportion of the EAP population. Current enabling environments are inadequate. NSPs are often mentioned in policies, but implementation of these policies is limited, and support to NSPs is rarely a significant feature of sector programs and investment plans. Informal service providers are particularly hard to monitor, regulate and penalize. In general, more success has been achieved through supportive, incentive and performance-based frameworks that encourage better and more pro-poor services than through prohibition and penalization.
22. Thank You!
Recent sanitation campaign in the Philippines: �Check your septic tank or swallow the consequences�