Download
1 / 25
250 likes | 515 Views
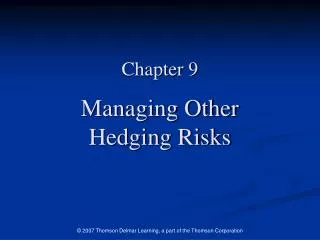
Models for Measuring and Hedging Risks in a Network Plan. Steven Cosares Hofstra University Hempstead, New York. Inter-connected links and nodes with switching capability. 2 units. 8 units. Robust Network Planning.

E N D
Models for Measuring and Hedging Risks in a Network Plan Steven Cosares Hofstra University Hempstead, New York
Inter-connected links and nodes with switching capability 2 units 8 units Robust Network Planning Design a network and place in sufficient link and node capacity to satisfy the expected demand for point-to-point connections in a cost-effective manner, while hedging against the prominent operating risks.
Planning Decisions Scheduling the expansion of link and node capacity during planning horizon • Routes for pt-to-pt connections • Timing / sizing of (equipment) purchases • Technology decisions • Adjustments to network topology
Demand Uncertainty Risk • Demand may not arise as anticipated. • Demand levels naturally fluctuate throughout the planning horizon – “Churn”. • Prior data determines a distribution of potential values. • Correlation / elasticity of demand for services across locations are hard to identify. Unexpected demands may not be served, resulting in a loss of potential revenue.
Connection Risk Some link or node (equipment) may fail during network operation, resulting in: • Temporary disruption of some services • Loss of customer revenue • Financial penalties, lawsuits • Exposure of customers to danger, e.g., loss of 911 service, home heat, electricity • Potential defection of customers
Utilization Risk Cost of lost opportunity associated with: • Over-estimating potential demand • Purchasing/placing capacity too early • Cost / Revenue uncertainty • Providing traffic protection to customers not paying for it • Dedicating protection capacity to unlikely or benign failure scenarios Address this risk to keep plan economical
B B C C 1 3 3 6 6 4 4 A A G 7 7 G 9 9 5 5 7 7 7 2 7 2 D 6 D F F 6 E E 3 3 Protection Routes Working Routes Hedging Connection Risk If the network is 2-connected and has accessible extra capacity, then network is “Survivable”: demands can still be satisfied even if some link or node is rendered useless.
Hedging Strategies • Route Diversity: Split traffic over multiple (diverse) paths to satisfy demand for a pt-to-pt connection. (Low Cost; Low Effectiveness) • Protection: Back-up paths with capacity to be used only during a network failure. May be dedicated to specific connections or to specific links. (High Cost; High Effectiveness) • Restoration: Use smart switching to access available capacity to recover traffic lost to a network failure. (Cost and effectiveness dependent on traffic distribution at failure time and on the quality of capacity decisions)
“Infinite Severity” Model Connection Risk Assumptions: • Any loss of traffic due to a link or node failure is unacceptable. • The relative probability of the potential network failure events is irrelevant. Hedging Strategy: “100% Survivability” All of the network traffic can be recovered despite any link or node failure in the network.
Infinite Severity Model • Providing 100% Survivability may be impossible or prohibitively expensive. • Cost-benefit analyses are irrelevant. (Math Prog. Model: Min Cost Objective w/ Survivability Constraints) • Some customers’ traffic may not warrant the expense of protection/restoration. • Some failure scenarios are more likely / more severe than others.
Model Formulation Let z represent the capacity assigned to the links. Let x(k) represent the allocation of connection paths to satisfy demand k. Network capacity should be sufficient to accommodate all demands under normal conditions: Path-arc incidence matrix for connections satisfying k
Formulation For each potential network failure f: Let y(k,f) represent the use of some paths to recover some of demand k after failure f. Some working path assignments for demand k are lost. Unmet demand Some network capacity is lost to the failure Modified path-arc incidence matrix for demand k during failure f
Formulation Controlling the level of survivability: Objective function: 100% Survivability Constraint: Capacity expansion
Flexible Alternatives Objective: Effective use of capital • Allow lower levels of Survivability • Apply targeted survivability constraints Specific customers’ demand or failure scenarios • Perform cost / benefit analyses for risk hedging • Models for marginal cost of restoration capacity • Valid (dollar-based) measures for connection risk • Integrated models for hedging both demand uncertainty and connection risk
Lower Survivability Levels What does it mean if a network is 90% Survivable? • At least 90% of the total traffic survives any failure. • Each customer is guaranteed that at least 90% of their traffic survives any failure. • In 90% of the possible failure scenarios, all of the traffic survives. • The probability that any unit of traffic will be lost to some failure is less than 10%. • The expected proportion of traffic to survive, over the possible failure events is 90%. For 100% all of these meanings are equivalent!
Pictorial Model – Demand k A: Average protection of demand k from potential failures B: Worst-case = Survivability guarantee for k C: Prob. that demand k is insulated from some random failure
The Severity of a Failure D: Proportion of total traffic surviving the failure. E: Minimum survivability guarantee provided to customers.
Modified Formulations Controlling the level of survivability: Through the objective function: and/or through the constraints: Capacity expansion cost Penalty for losing service Functions to set appropriate limits on loss
Modified Formulations Constraints on loss of demand k: Constraint on severity of failure f: These can be applied flexibly to specific demand/failures. (Area A in chart is 90%) (Length C in chart is 50%) (Area D in chart is 90%)
Costs/Benefits of Hedges • Penalty function must capture (true) costs of disrupted connections – beyond revenue loss. • The parameter λ allows planner to control tradeoff between survivability and expansion costs. Note: The MILP problem as formulated is quite large and complex
Integrated Models Restoration (protection) capacity also provide a hedge against demand uncertainty. • Develop planning models that measure the combined effectiveness of hedging strategies • Survivability measures when demand is uncertain • Measuring the marginal costs associated with hedging capacity – which capacity is extra?! • MILP formulation is even more complex!
Integrated Evaluations • At least 90% survivability is provided (to the offered services) in every demand scenario. • The average network survivability over the demand scenarios is at least 90%. • In at least 90% of the demand scenarios there is 100% survivability (for the offered services). • At least 90% of the demands are offered 100% survivability in all of the demand scenarios.
Hedging Uncertainty Risk If accessible capacity is placed throughout the network at sufficient levels, the network might accommodate a variety of potential demand scenarios. Deterministic Approach: Apply a solution model based on the expected pt-to-pt demand levels (or some higher percentile). Stochastic Programming Approach: Maximize some probabilistic profit function based on the service provided over a set of demand scenarios.
Simulation-based Approach • For each demand scenario, determine a routing over the network topology. • For each node / link, collect statistics about the capacity requirements, e.g., Percentage of scenarios in which the capacity is sufficient to accommodate all of the demands
Approach, cont’d Determine a capacity level: (Note similarity to “Newsvendor model”) Revenue index + shortage penalty = 10 * Cost index + overage penalty Note: Shortage penalty ratio would have to be set above 20 for the min-risk capacity to be the most profitable.