Download
1 / 47
500 likes | 576 Views
Laboratory Experiment to Determine Batch Ethanol Production by S. cerevisiae. Benjamin Reves May 11, 2005. Outline. Background Theory Procedure Results Conclusions Recommendations Impact Questions. Background. Need for Ethanol.

E N D
Laboratory Experiment to Determine Batch Ethanol Production by S. cerevisiae Benjamin Reves May 11, 2005
Outline • Background • Theory • Procedure • Results • Conclusions • Recommendations • Impact • Questions
Need for Ethanol • Ethanol used as raw material and solvent in the chemical, food, and pharmaceutical industries • Four million tons of ethanol are produced each year • Eighty percent by fermentation • Energy Information Administration has predicted annual consumption growth in U.S. of 3.2% each year
Saccharomycescerevisiae • Common type of yeast • Eucaryotic • Reproduces by budding • Can grow aerobically or anaerobically
Current Methods • Batch Reactor • Fed-batch Reactor • Continuous Reactor • Packed Bed Reactor
Glycolysis • Breakdown of 6-C glucose into two molecules of 3-C pyruvate • Fate of pyruvate • Aerobic Conditions- TCA cycle • Anaerobic Conditions- Converted to ethanol via acetaldehyde
Cell Growth • Substrates + cells extracellular products + more cells
Batch Growth • Lag Phase • Exponential Growth Phase • Deceleration Phase • Stationary Phase • Death Phase
Yield Coefficients • Help to quantify growth kinetics • YX/S=-X/S • YP/S= -P/S • YP/X= P/X
Product Formation • Growth-associated products • Non-growth-associated products • Mixed-growth-associated products
Temperature Effects • Optimal temperatures • Product formation affected • Diffusion limitations
Objectives • Study ethanol production and glucose utilization by Saccharomycescerevisiae • Study effect of temperature on fermentation • Construct growth curves
Stages of Experimentation • Autoclaving • Inoculation • Growth of Culture • Analyzing Samples
Autoclaving • Sterility is a must! • Saturated steam at 121oC used to kill all spores
Preparing Inoculum • Inoculum is typically 5-10% of total working volume • Yeast obtained from microbiology department on plates • Inoculating needle used to take yeast from plate into 800 mL of YEB • Placed on shaker at 30oC • Importance of inoculum condition
Yeast Extract Broth • Undefined vs. Defined Media • 1 L YEB contains: • 20 grams of glucose • 10 grams of yeast extract broth • Glucose is carbon/energy source • Yeast extract provides cofactors and ions
Fermentor • 7.5 L BioFlo 110 Modular Benchtop Fermentor • Controller and PCU • Temperature Control
Taking Samples • Fermentor equipped with sample port • Sample tubes had been autoclaved • Optical density of sample measured • Centrifuged for 5 minutes at 2000 rpm • Liquid decanted and stored at 4oC
Estimating Cell Concentration • Spectrophotometer used to measured absorbance at 650 nm • Sterile YEB used as blank • Beer’s Law: A=bc • Linear correlation between absorbance and concentration of cells • Calibration curve constructed
Construction of Calibration Curve • Optical density measured • Washed with 10 mM phosphate buffer • Dried in oven at 35 Celsius
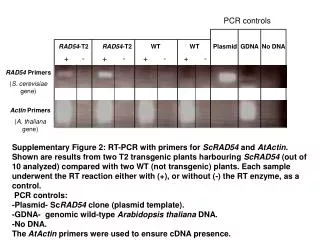
Glucose Determination • Glucose assay kit ordered from Sigma • Based on UV absorbance of NADH at 340 nm • Glucose + ATP Glucose-6-Phosphate + ADP • G6P + NAD+ 6-Phosphogluconate + NADH • Samples Diluted Hexokinase G6PDH
Ethanol Determination • Ethanol assay kit ordered from R-Biopharm • Based on absorbance of NADH at 340 nm • Sample diluted • Ethanol + NAD+ acetaldehyde + NADH + H+ • Acetaldehyde + NAD+ + H2O acetic acid + NADH + H+ ADH Al-DH
Conclusions • Yeast grew the fastest at 30 Celsius • Lag times were longer at 25 and 37 Celsius • Glucose was fully used in each run • Amount of ethanol produced was almost the same for each run • Runs should be allowed to proceed longer
Recommendations • Determine growth and productivity effects due to other factors such as pH • Determine optimal inoculum size and age • Investigate better methods of analyzing samples • Operate fermentor in other manners: continuous, continuous with recycle, fed-batch
Impact • Typically carried out at graduate level • CBU has ability to perform at undergraduate level • Hope to collaborate with School of Sciences in the future