Download
1 / 45
480 likes | 1.01k Views
Compendium on Preterm Birth. Produced in cooperation with: American Academy of Pediatrics The American College of Obstetricians and Gynecologists Association of Women’s Health, Obstetric and Neonatal Nurses. Epidemiology & Biology of Preterm Birth. © March of Dimes 2006. Objectives.

E N D
Compendium on Preterm Birth Produced in cooperation with: American Academy of Pediatrics The American College of Obstetricians and Gynecologists Association of Women’s Health, Obstetric and Neonatal Nurses Epidemiology & Biology of Preterm Birth © March of Dimes 2006
Objectives • At the completion of this section, participants should be able to: • Describe the epidemiologic and economic factors associated with preterm birth • Recognize: • Definitions • Major risk factors • Pathways leading to preterm birth • Clinical diagnosis • Express the significance of preterm birth as an important public health issue
Preterm (or premature) infant infant born before 37 completed weeks of gestation Late preterm infant (a recently identified category) infant born between 34 and 36 weeks gestation Moderately preterm infant infant born between 32 and 36 completed weeks of gestation Very preterm infant infant born before 32 completed weeks of gestation Definitions Sources: Iams JD, Creasy RK. Preterm labor and delivery, Chapter 34. In: Maternal-Fetal Medicine: Principles and Practice, 5th ed., 2004; Davidoff MJ et al. Semin Perinatol 2006;30:8-15.
Low birthweight (LBW) infant who weighs less than 2,500 grams at delivery Very low birthweight (VLBW) infant who weighs less than 1,500 gramsat delivery Extremely low birthweight (ELBW) infant who weighs less than 1,000 gramsat delivery Definitions Source: Iams JD, Creasy RK. Preterm labor and delivery, Chapter 34. In: Maternal-Fetal Medicine: Principles and Practice, 5th ed., 2004.
< 1,000 grams 0.7% (of live births) Most (99.3%) are preterm 1,000-2,500 grams 7.2% 63.9% are preterm > 2,500 grams 92.1% 7.6% are preterm Prematurity & Low Birthweight, U.S., 2003 Low birthweight is less than 2,500 grams (5 1/2 pounds). Preterm is less than 37 completed weeks gestation. Source: National Center for Health Statistics, 2003 natality file Prepared by March of Dimes Perinatal Data Center, 2006.
Low birthweight is less than 2,500 grams (5 1/2 pounds). Preterm is less than 37 completed weeks gestation. Source: National Center for Health Statistics, 2003 natality file. Prepared by the March of Dimes Perinatal Data Center, 2006. Overlap in LBW, Preterm & Birth Defects, U.S., 2003 Low Birthweight Births 7.9% Preterm Births 12.3% Among LBW: 2/3 are preterm Among preterm: more than 43% are LBW (some preterm are not LBW) Birth Defects ~3-4%
Preterm is less than 37 completed weeks gestation. Source: National Center for Health Statistics, 2003 natality file. Prepared by the March of Dimes Perinatal Data Center, 2006. All Preterm Births by Gestational Age, U.S., 2003 71% of PTB is at 34, 35, 36 weeks (36 Weeks) (35 Weeks) (<32 Weeks) (32 Weeks) (34 Weeks) (33 Weeks)
Preterm is less than 37 completed weeks gestation. Very preterm is less than 32 completed weeks gestation. Source: National Center for Health Statistics, final natality data. Prepared by March of Dimes Perinatal Data Center, 2006. Preterm & Very Preterm BirthsUnited States, 1993-2003 Percent of live births Healthy People Objective
*Deaths to infants less than one year of age. Source: National Center for Health Statistics, 1992 final mortality data and 2002 period-linked birth/infant death data. Prepared by the March of Dimes Perinatal Data Center, 2006. Selected Leading Causes of Infant Mortality*United States, 1992 & 2002 2002 Rank Rate per 100,000 live births 1 2 3 6
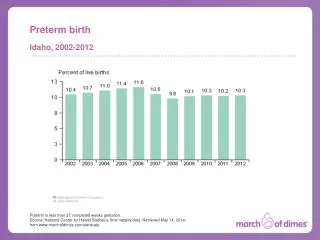
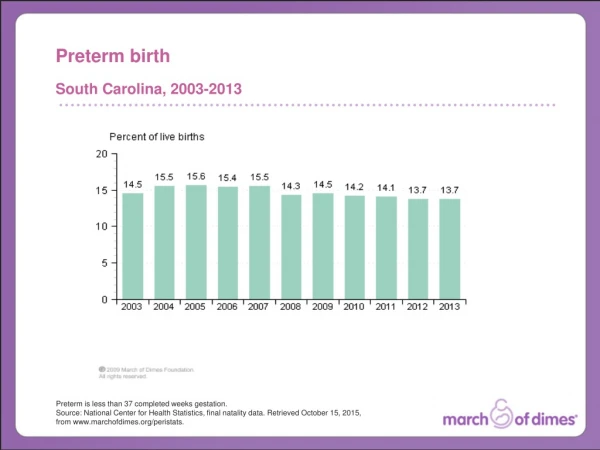
Preterm is less than 37 completed weeks gestation. Source: National Center for Health Statistics, 2003 final natality data. Prepared by March of Dimes Perinatal Data Center, 2006. Preterm BirthsUnited States, 1983-2003 Percent Healthy People Objective 28 Percent Increase
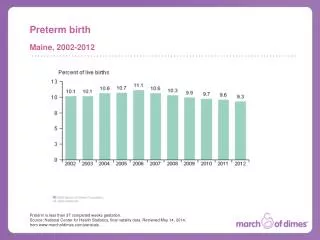
Preterm is less than 37 completed weeks gestation Source: National Center for Health Statistics, 2003 final natality data. Prepared by March of Dimes Perinatal Data Center, 2006. Preterm Birthsby Maternal Age, United States, 2003 Percent
Preterm Births by Maternal Race/Ethnicity, U.S., 1993-2003 Percent Preterm is less than 37 completed weeks gestation. Source: National Center for Health Statistics, final natality data. Prepared by March of Dimes Perinatal Data Center, 2006.
Preterm Birth Rates by State United States, 2003 U.S. Total = 12.3% Percent of Live Births Over 13.0 (16) 11.6 to 13.0 (18) Under 11.6 (17) Note: Value in ( ) = number of states (includes District of Columbia). Value ranges are based on equal counts. Source: National Center for Health Statistics, 2003 final natality data. Prepared by March of Dimes Perinatal Data Center, 2005.
Economic Consequences of Preterm Birth • Hospital charges for premature infants1 totaled $18.1 billion in 2003. • Premature infants accounted for half of the hospital charges for all infants($36.7 billion). • The average charge for the most severe stays2 was $77,000 compared to $1,700 for an uncomplicated newborn stay. 1Includes any diagnosis of prematurity/low birthweight 2Defined as having a principal diagnosis of prematurity Source: Agency for Healthcare Research and Quality, 2003 Nationwide Inpatient Sample. Prepared by March of Dimes Perinatal Data Center, 2006.
Average Length of Stay for Selected Inpatient Infant Hospitalizations, U.S., 2003 24.2 13.6 2.0 Agency for Healthcare Research and Quality, 2003. Nationwide Inpatient Sample.Prepared by March of Dimes Perinatal Data Center, 2006.
100 80 60 40 20 0 Infant Hospital Stays Infant Hospital Charges Distribution of Hospital Stays & Hospital Charges, U.S., 2003 All other infant stays 4,301,000 ~91% Hospital charges for all other infant stays $18.6 billion Infant stays with any diagnosis of prematurity 413,000 ~9% 12.9 Hospital charges for infant stays with any diagnosis of prematurity $18.1 billion Agency for Healthcare Research and Quality, 2003. Nationwide Inpatient Sample. Prepared by March of Dimes Perinatal Data Center, 2006.
Percent of Hospital Charges for Preterm Birth by Expected Payer, U.S., 2002 Medicaid46.3% Uninsured/Self Pay2.3% Almost half of hospital charges for premature infants, or about $7.4 billion, were billed to employers and other private insurers. Private/Commercial47.8 Other*3.6% *Includes Medicare Source: Agency for Healthcare Research and Quality, 2002. Nationwide Inpatient Sample.Prepared by March of Dimes Perinatal Data Center, 2006.
Costs to Employers Based on analysis of births in 2001 followed for 12 months. Expenditures have been adjusted to 2004 dollars using the medical component of the CPI. Data largely from self-insured U.S. employers. Research conducted and underwritten by Thomson Medstat.
Health-care costs e.g., monetary value related to use of community health services Educational costs e.g., additional assistance (such as special education) required as a result of school failure & learning problems Social service costs e.g., utilization of developmental services such as day care programs, case management & counselling, or respite care & residential care Out-of-pocket expenses e.g., additional travel costs related to going to health & social care providers or accommodation expenses Long-term Care Costs Sources: Petrou S et al. Child Care Health Dev. 2001;27:97-115; Petrou S et al. Early Hum Dev. 2006;82:77-84.
Many women think a baby born prematurely is “meant to be,” and its preterm birth can’t be prevented. U.S. adults do not perceive preterm birth to be a serious public health problem. Source: Massett HA et al. Am J Prev Med 2003; 24:120-7. Public Opinion About Prematurity
Genetic contribution Environmental influences Gene-environment interactions Preterm Birth A Common, Complex Disorder
#1 cause of neonatal mortality (<28 days) in the U.S. #2 cause of infant mortality (<1 year) in the U.S. #1 cause of infant mortality for non-Hispanic black infants in the U.S. Sources: Mathews TJ, MacDorman MF. Natl Vital Stat Rep 2006;54:1-29; National Center for Health Statistics, 2003 period- linked birth/infant death data. Prepared by March of Dimes Perinatal Data Center, 2006. Preterm Birth
Perinatal Mortality & Gestational Age Source: Mercer BM. Preterm premature rupture of the membranes.Obstet Gynecol 2003;101:178-93. Reproduced with permission from Lippincott Williams & Wilkins.
The Morbidity of Prematurity Neonatal • Respiratory distress syndrome (RDS) • Intraventricular hemorrhage (IVH) & periventricular leukomalacia (PVL) • Necrotizing enterocolitis (NEC) • Patent ductus arteriosus (PDA) • Infection • Metabolic abnormalities • Nutritional deficiencies Short term • Feeding and growth difficulties • Infection • Apnea • Neurodevelopmental difficulties • Retinopathy • Transient dystonia Long term • Cerebral palsy • Sensory deficits • Special health care needs • Incomplete catch-up growth • School difficulties • Behavioral problems • Chronic lung disease Source: Iams JD, Creasy RK. Preterm labor and delivery, Chapter 34. In: Maternal-Fetal Medicine: Principles and Practice, 5th ed., 2004.
Source: Mercer BM. Preterm premature rupture of the membranes.Obstet Gynecol 2003;101:178-93. Reproduced with permission from Lippincott Williams & Wilkins. Perinatal Morbidity & Gestational Age
What are the conditions leading to preterm birth? Spontaneous - 75% Preterm labor Preterm premature rupture of membranes (PPROM) Multiple gestation Cervical insufficiency Other related diagnoses Clinically Indicated - 25% Mother or fetus at risk Classification of Preterm Birth Sources: Goldenberg RL et al. Am J Public Health 1998;88:233-8; Meis PJ et al. Am J Obstet Gynecol 1995;173:597-602; Meis PJ et al. Am J Obstet Gynecol 1998;178:562-7.
Clinical presentations Preterm labor - 50-60% Preterm premature rupture of membranes (PPROM) - 40-50% Risk factors similar PPROM More often smokers, 2nd trimester bleeding, low socioeconomic status (SES) 50% have no risk factors Sources: Goldenberg RL et al. Am J Public Health 1998;88:233-8; Meis PJ et al. Am J Obstet Gynecol 1995;173:597-602; Meis PJ et al. Am J Obstet Gynecol 1998;178:562-7. Spontaneous Preterm Births
Preeclampsia 43% Fetal distress 28% Inadequate intrauterine fetal growth 10% Abruption 7% Fetal demise 7% Source: Meis PJ et al. Am J Obstet Gynecol 1998;178:562-7. Clinical Indications for Preterm Deliveries
Maternal age (<18 and >35 years) Low socioeconomic status (SES) Unmarried African-American ancestry Demographic Characteristics of Populations at Risk for Preterm Birth
Known Risk Factors for Preterm Birth Epidemiologic • history of preterm birth • unintended pregnancy • previous fetal or neonatal death • 3+ spontaneous losses • assisted reproductive technology (ART) • genetic predisposition • folic acid deficiency • environmental toxins • low pre-pregnancy weight • obesity • anemia • lack of social support • tobacco use • alcohol abuse • illicit drug use Source: Iams JD, Creasy RK. Preterm labor and delivery, Chapter 34. In: Maternal-Fetal Medicine: Principles and Practice, 5th ed., 2004.
Known Risk Factors forPreterm Birth(continued) Inflammation Decidual hemorrhage • systemic maternal disease • infections • preterm premature rupture of membranes (PPROM) • fetal / placental anomalies • bleeding • trauma Overdistension/uterine problems Activation of maternal hypothalamic pituitary adrenal (HPA) axis • multifetal pregnancy • overdistension • uterine abnormalities • cervical abnormalities • stress / violence Source: Iams JD, Creasy RK. Preterm labor and delivery, Chapter 34. In: Maternal-Fetal Medicine: Principles and Practice, 5th ed., 2004.
Common Risk Factors for Preterm Birth • Multiple gestation • Infection • Stress • Bleeding • Nutrition • Excessive physical activity • Prior preterm birth • Uterine factors • Cervical length • Contractions • Anomalies • Distention • Ancestry and ethnicity Source: Martin JA et al. Natl Vital Stat Rep. 2005;54:1-116; Iams JD, Creasy RK. Preterm labor and delivery, Chapter 34. In: Maternal-Fetal Medicine: Principles and Practice, 5th ed., 2004.
Multiple Gestation OR 6 compared to singleton births Prior Preterm Delivery OR 4 compared to no history of preterm birth 2nd Trimester Bleeding OR 2 or > compared to no early bleeding (before 28 weeks) Genito-Urinary (GU) Tract Infection OR 2 compared to no GU infection African-American OR 2 compared to non African-American ancestry Body Mass Index <19.8 kg/m2 OR 2 compared to body mass index 19.8 kg/m2 Epidemiology of Spontaneous PTB Source: Iams JD, Creasy RK. Preterm labor and delivery, Chapter 34. In: Maternal-Fetal Medicine: Principles and Practice, 5th ed., 2004.
Preterm is less than 37 completed weeks gestation. Source: National Center for Health Statistics, 2003 final natality data. Prepared by March of Dimes Perinatal Data Center, 2006 Preterm Births by PluralityUnited States, 2003 Percent
Multiple births include twins, triplets, and higher order births. *Race of child from 1980-1988; race of mother from 1989-2003. Source: National Center for Health Statistics, 1980-2003 final natality data. Prepared by March of Dimes Perinatal Data Center, 2006 Multiple Birth Ratios by Race*United States, 1980-2003 Ratio per 1,000 live births
Rises with increased number of preterm deliveries (PTDs) Rises as gestational age of prior PTD declines Most recent birth is more predictive Risk greater in African-Americans Source: Mercer BM et al. Am J Obstet Gynecol 1999;181:1216-21. Recurrence Risk of Preterm Birth
Population-based cohort study — Georgia 1980 to 1995 122,722 white women and 56,174 black women Of 1,023 white women w/ 1st delivery @ 20-31 weeks 8.2% delivered 2nd at 20-31 weeks 20.1% delivered 2nd at 32-36 weeks Total preterm deliveries = 28.3% < 36 wk Of 1,084 black women w/ 1st delivery @ 20-31 weeks 13.4% delivered 2nd at 20-31 weeks 23.4% delivered 2nd at 32-36 weeks Total preterm deliveries = 36.8% < 36 wk Source: Adams MM et al. JAMA 2000;283:1591-6. Recurrent Preterm Delivery
Source: Reprinted from Ultrasonography in Obstetrics and Gynaecology, 4th ed., Callen PW, Copyright 2000, with permission from Elsevier. Transvaginal Cervical Sonography
Source: Zilianti M et al. Monitoring the effacement of the uterine cervix by transperineal sonography: a new perspective. J Ultrasound Med 1995;14:719-24. Reproduced with permission from the American Institute of Ultrasound in Medicine. Cervical Effacement = T Y V U T Y V U
Iams JD, Goldenberg RL, Meis PJ, et al. The length of the cervix and the risk of spontaneous premature delivery. N Engl J Med 1996;334:567-72. Copyright 1996 Massachusetts Medical Society. All rights reserved. Relative Risk of Spontaneous Preterm Delivery < 35 Weeks by Percentile of Cervical Length at 24 Weeks NICHD MFMU Network
Iams JD, Goldenberg RL, Meis PJ, et al. The length of the cervix and the risk of spontaneous premature delivery. N Engl J Med 1996;334:567-72. Copyright 1996 Massachusetts Medical Society. All rights reserved. Risk of Spontaneous Preterm Delivery < 35 weeks by Cervical Length at 24 weeks NICHD MFMU Network
Cervical length is a bell curve. The risk of spontaneous preterm delivery increases as cervical length decreases. This occurs across the entire range of cervical length, not just < 10th %. Cervical LengthNew Information from Ultrasound Source: Iams JD et al. N Engl J Med 1996;334:567-72; Taipale P, Hiilesmaa V. Obstet Gynecol. 1998;92:902-7; Goldenberg RL et al. Am J Public Health 1998;88:233-8.
Cervical function is variable and relative Long cervix = Low risk of preterm birth, more likely to carry twins to term Short cervix = Greater risk of preterm birth Very short cervix = Greatest risk of early preterm birth Why is the cervix short? Individual or combined effect of: Biological variation • Inflammation Contractions • Surgery/procedure A Continuum of Cervical Function Source: Iams JD, Creasy RK. Preterm labor and delivery, Chapter 34. In: Maternal-Fetal Medicine: Principles and Practice, 5th ed., 2004.
Inflammation Infection - ~40% Activation of the maternal-fetal hypothalamic– pituitary–adrenal (HPA) Axis Stress - ~30% Decidual hemorrhage Abruption - ~20% Uterine distension Stretching - ~10% Pathways to Preterm Birth Sources: Lockwood CJ, Iams JD. Preterm labor and delivery. Precis: Obstetrics, 3rd ed. ACOG, 2005; Lockwood CJ, Kuczynski E. Paediatr Perinat Epidemiol 2001;15:78-89.
Source: Lockwood CL. Unpublished data, 2002. Pathways to Preterm Birth Inflammation Decidual Hemorrhage Activation of Maternal-FetalHPA Axis Pathological Uterine Distention • Infection: - Chorion-Decidual - Systemic Abruption • Multifetal Pregnancy • Polyhydramnios • Uterine Abnormality • Maternal-Fetal Stress • Premature Onset of Physiologic Initiators Thrombin Thrombin Rc Ils, Fas L TNF Mechanical Stretch Gap jct PG synthase Oxt recep CRH E1-E3 Chorion Decidua + CRH + proteases uterotonins PPROM Uterine Contractions Cervical Change PTD