Download
1 / 39
390 likes | 635 Views
Measures that Save The Most Energy. Jackie Berger David Carroll ACI New Jersey Home Performance Conference January 25, 2007. Session Outline. Introduction Key Concepts Projected Savings vs. Measured Savings Average Savings by Type of Measure Energy Education Savings Potential

E N D
Measures that Save The Most Energy Jackie Berger David Carroll ACI New Jersey Home Performance Conference January 25, 2007
Session Outline • Introduction • Key Concepts • Projected Savings vs. Measured Savings • Average Savings by Type of Measure • Energy Education Savings Potential • Maximizing Measure Savings • Conclusions
Introduction - Focus • Focus – Measures that save the most… • Energy per measure • Energy per household • Energy per dollar spent • Other Important Issues • Measures that save the most… • Electricity, gas, or fuel oil • Greenhouse gas emissions • Lives • Measures that furnish the greatest… • Avoided costs • Economic benefits • Note: Dollars saved vary with energy price
Introduction - Scope • Sources • APPRISE evaluation studies • Blasnik and Associates evaluation studies • Dalhoff and Associates evaluation studies • Geographic scope • Northeast • Midwest • Mountain
Key Concepts • Measures that save the most: • Target highest use households • In a way that maximizes effectiveness • With an understanding of what is going on in this house • Measures that save the most per dollar spent • Balance delivery costs with energy saving opportunities • Spend less when there are fewer opportunities • Spend more when there are more opportunities • We recommend using “measured savings”
Measure Effectiveness • Duct Sealing • Ducts outside envelope = High Savings • Ducts inside envelope = Low/No Savings • Ducts in basement = ???? • Ducts in crawl space = ???? • Insulation • With properly seal envelope = High Savings • Without air sealing = Low Savings
Focus on This House • Example – Baseload Job in Massachusetts House • Previsit Information: Annual electric usage of 10,000 kWh • On-Site Measurement: 6,000 kWh for appliances / 4,000 kWh for space heater • Problem: Program only pays for baseload measures • Solution: Install cfls, encourage behavioral changes, and refer to electric heat program
Projected Savings vs. Measured Savings • Value of projections • Projection methodology • Issues with projections • Comparison of projected savings to measured savings
Projections vs. Impacts • Basic Projection Methodology • Assumptions • Measure installation rates • Measure retention rates • Pre installation usage • Measure effectiveness
Projections vs. Impacts • Basic Projection Methodology • Calculation • Average household saving = Measure Installation Rate * Measure Retention Rate * (Pre Installation Usage – Post Installation Usage)
Projections vs. Impacts • Basic Projection Methodology • Calculation • Pre Installation Usage per bulb per hour = 60 watts * .001 = .06 kWh • Post Installation Usage per bulb per hour = 13 watts * .001 = .013 kWh • Change per Bulb per hour =.06 - .013 = .047 kWh
Projections vs. Impacts • Basic Projection Methodology • Calculation • Change per bulb per day = .047 kWh * 2.5 hours/day = .1175 kWh/day • Change per bulb per year = . 1175 kWh/day * 365 days = 43 kWh/year
Projections vs. Impacts • Basic Projection Methodology • Calculation • Number installed per home = 43 kWh * 8 bulbs = 344 kWh • Retention rate = 344 kWh *.8 = 275 kWh saved per home per year
Projections vs. Impacts So simple, what could go wrong… • Incorrect assumptions • Measure installation rate • Measure retention rate • Bulbs left for occupants to install • Bulbs removed • Bulbs broken • Existing bulb kWh • Hours of use
Projections vs. Impacts • Source: M. Blasnik and Associates.
Projections vs. Impacts How far are we off with the projections? • Evaluations that measure actual usage impacts usually find 50% to 70% of projected savings • NEAT Audit – measured savings were 57% and 54% of projected savings (Sharp, 1994 and Dalhoff, 1997) • Ohio electric baseload savings were 58% to 68% of projected • NJ electric baseload savings were 60% - 69% of projected Source: M. Blasnik and Associates.
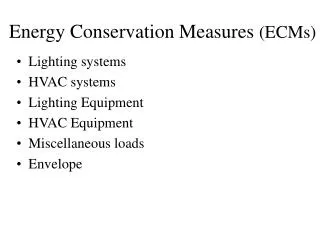
Average Savings by Measure Type • Methodology for developing measured savings • Methodology for attribution of savings to measures • Evaluation findings – electric baseload • Evaluation findings – space heating measures
Usage Impact Analysis • Usage Impact Methodology • Obtain pre and post energy usage data for program participants • Use regression model to adjust usage for changes in weather from “normal weather year” • Construct weather normalized change in usage for treated households • Construct weather normalized change in usage for comparison households
Usage Impact Analysis • Usage Impact Methodology • Run regression to determine measure specific impacts Usage change = α + β * household characteristics + γ1* measure1 + γ2* measure2 + γ3* measure3 + μ
Measure Savings – Evaluation Findings Source: M. Blasnik and Associates.
Measure Savings – Evaluation Findings Source: M. Blasnik and Associates.
Measure Savings – Evaluation Findings Source: M. Blasnik and Associates.
Measure Savings – Evaluation Findings Source: M. Blasnik and Associates.
Potential for Education • Major opportunities • Potential vs. realization • Successful models
Potential Education Savings AC – 72 to 75 degrees, heating 72 to 70 degrees
Maximizing MeasureSavings • Look at energy bills • Do diagnostic tests /take measurements • Apply bills, tests, and measurements to decision criteria • Build a package of measures that are complimentary and complete
Tests and Measurements • Determine how each system is performing • HVAC • Thermal envelope • Heating / cooling distribution • Equipment Performance • Controls • Other end uses • Refrigerator metering • Water flow test
Decision Criteria • Technical • Audit Tool (e.g. NEAT audit) • Priority List • Rule of Thumb • Financial • Spending limit • Spending goal • Spending target • Financial incentives
Issues - Technical • No Usage Data • Decisions without most essential data • Limited Usage Data • Decisions without information on seasonality • Audit Models • Data entry sometimes gets in the way of investigating source / causes of usage problems • Note: Data entry on baseline conditions and treatments is essential for program management
Issues - Financial • Spending Limits • Do they focus delivery on highest saving measures or restrict delivery of cost-effective measures? • Spending Goals • Do they ensure comprehensiveness or encourage a program to over-invest? • Spending Target • Do they furnish flexibility or result in over-investment in some homes and under-investment in others?
Recommendations • Usage Data – Essential for good decision-making • Decision Criteria - Field staff need a good tool for determining which measures to install • Financial Guidelines – Should vary with energy savings potential and should be expressed as a range
Conclusions • Insulation / Air Sealing / Duct Sealing – In Northeast and Midwest, well-designed and implemented programs are big energy savers • Electric Baseload – Refrigerators and cfls save lots of energy, particularly if highest using households are targeted • Energy Education Potential – Behavioral changes have the potential to achieve large energy savings, but we have not seen any programs with significant measured energy savings
Contact Information • Jackie Berger, 609-252-8009, jackie-berger@appriseinc.org • David Carroll, 609-252-8010, david-carroll@appriseinc.org