Download
1 / 27
270 likes | 569 Views
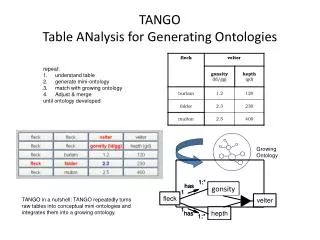
TANGO Table ANalysis for Generating Ontologies. Yuri A. Tijerino*, David W. Embley*, Deryle W. Lonsdale* and George Nagy** * Brigham Young University ** Rensselaer Polytechnic Institute. List of contents. Motivation Applications Table understanding Concept matching

E N D
TANGOTable ANalysis for Generating Ontologies Yuri A. Tijerino*, David W. Embley*, Deryle W. Lonsdale* and George Nagy** * Brigham Young University ** Rensselaer Polytechnic Institute
List of contents • Motivation • Applications • Table understanding • Concept matching • Ontology merging/growing • Example • Future direction
Motivation • Semi-automated ontological engineering through Table Analysis for Generating Ontologies (TANGO) • Keyword or link analysis search not enough to search for information in tables • Structure in tables can lead to domain knowledge which includes concepts, relationships and constraints (ontologies) • Tables on web created for human use can lead to robust domain ontologies
TANGO Applications • Extraction ontologies (generation) • Data integration • Semantic web • Multiple-source query processing • Document image analysis for documents that contain tables
Table understanding • What is a table? • Why table normalization? • What is table understanding? • What is mini-ontology generation?
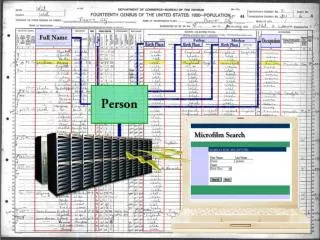
Table understanding:What is a table? • “…a two-dimensional assembly of cells used to present information…” • Lopresti and Nagy • Normalized tables (row-column format) • Small paper (using OCR) and/or electronic tables (marked up) intended for human use
Table understanding:What is table normalization? Raw table Table normalization means to take any table and produce a standard row-column table with all data cells containing expanded values and type information Normalized table
Table understanding:Information useful for normalization • Captions – in vicinity of table (above, below etc) • Footnotes – on annotated column labels or data cells • Embedded information – in rows, columns or cells {e.g., $, %, (1,000), billions, etc} • Links to other views of the table, possibly with new information
What is table understanding? • Normalize table • Take a table as an input and produce standard records in the form of attribute-value pairs as output • Discover constraints among columns • Understand the data values {<Country: Afghanistan>, <GDP/PPP: $21,000,000,000>, <GDP/PPP per capita: $800>, <Real-growth rate: ?>, <Inflation: ?>} Left-most, primary key {has(Country, GDP/PPP),has(Country,GDP/PPP Per Capita), has(Country,Real-growth rate*), has(Country, Inflation*) Country names (from data frame) Dollar amount (from data frame) Percentage (from data frame)
Example:Creating a domain ontology Longitude Latitude Latitude and longitude designates location Name Geopolitical Entity Location Distances Includes procedural knowledge names has Has GMT Duration between Time zones Time Country City Has associated data frames
Agglomeration Population Country Continent Example:Table understanding to mini-ontology generation
Longitude Longitude Latitude Latitude Agglomeration Population Latitude and longitude designates location Latitude and longitude designates location Country Continent Name Name Geopolitical Entity Geopolitical Entity Location Location names names has has Time Time Longitude Latitude Population Country Country City City Latitude and longitude designates location Name Geopolitical Entity Location Continent Country Agglomeration City Example:Concept matching to ontology Merging Merge Results Has GMT Has GMT
Concept matching • We use exhaustive concept matching techniques to match concepts from different mini-ontologies, including: • Lexical and Natural Language Processing • Value Similarity • Value Features • Data Frame Comparison • Constraints
Concept Matching (Lexical & NLP) • Lexical • Direct comparisons (substring/superstring) • WordNet (Synonyms, Word Senses, Hypernyms/Hyponyms) • Natural Language Processing • Phrases in column headers • Footnotes (for columns, rows, values) • Explanations of symbols, rows, columns • Titles and subtitles
Concept Matching (Value Similarity) • Compute overlap for string values comparing data sets • Compute overlap for numeric values comparing Gaussian Probability Distributions • Compute similarity of numeric values using regression
Concept Matching (Value Similarity) Real-world example Total of 193 cells in A Total of 267 cells in B 77 fields in B not in A 3 fields in A not in B 190 total matches Proportion of matches with respect to A = 190/193 = 98% Proportion of matches with respect to B = 190/267 = 71% In B not in A In A not in B In B not in A A B
Concept Matching (Value Similarity) Gaussian PDF Total of 170 cells in A Total of 240 cells in B 50 fields in B not in A 2 fields in A not in B 168 total matches Proportion of matches with respect to A = 168/170 = 99% Proportion of matches with respect to B = 168/240 = 70% In B not in A In A not in B In B not in A A B
Concept Matching (Value Features) • We can also compute similarities from value characteristics such as: • Character/numeric length, ratio • Numeric values mean, variance, standard deviation
Concept Matching (Data frames) • Snippets of real-world knowledge about data (type, length, nearby keywords, patterns [as in regexps], functional, etc) • We have used data frames to • Recognize data types • Include recognizers for values (dates, times, longitude, latitude, countries, cities, etc) • Provide conversion routines • Match headers, labels, footnotes and values • Compose or split columns (e.g., addresses)
Concept Matching (Constraints) • Keys in tables (as well as nonkeys) • Functional relationships • 1-1, 1-*, *-1 or *-* correspondences • Subset/superset of value sets • Unknown and null values
Ontology merging/growing • Direct merge (no conflicts) • Use results of matching phase to find similar concepts in ontologies (e.g., data value similarities, data frames, NLP, etc) • Conflict resolution • Interactively identify evidence and counter evidence of functional relationships among mini-ontologies using constraint resolution • IDS Interaction with human knowledge engineer • Issues – identify • Default strategy – apply • Suggestions – make
Longitude Latitude Place Name Elevation State USGS Quad Place ⊎ Area Country City/town Lake Reservoir Mine Example: Another mini-ontology generation
Longitude Latitude Place Name Elevation State USGS Quad Place ⊎ Area Country City/town Lake Reservoir Mine Example: Another mini-ontology generation Merge Longitude Latitude Population Latitude and longitude designates location Name Geopolitical Entity Location names has has GMT Time Continent Country Agglomeration City
Example: Concept Mapping to Ontology Merging Longitude Latitude Population Latitude and longitude designates location Name Geopolitical Entity Location names has has GMT Time Geopolitical Entity with population Elevation State USGS Quad Place ⊎ Area Country Continent Country Agglomeration City/town Lake Reservoir Mine
Future direction • Start with multiple tables (or URLs) and generate mini-ontologies • Identify most suitable mini-ontologies to merge by calculating which tables have most overlap of concepts • Generate multiple domain ontologies • Integrate with form-based data extraction tools (smarter Web search engines)