Download
1 / 49
490 likes | 954 Views
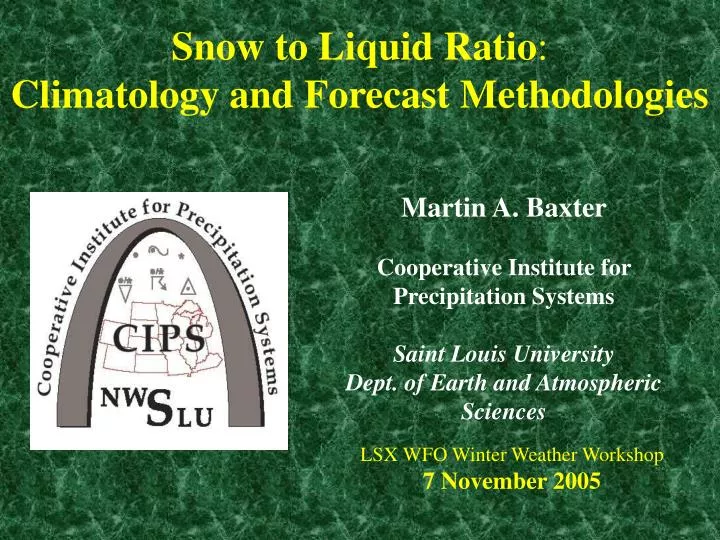
Snow to Liquid Ratio : Climatology and Forecast Methodologies. Martin A. Baxter Cooperative Institute for Precipitation Systems Saint Louis University Dept. of Earth and Atmospheric Sciences. LSX WFO Winter Weather Workshop 7 November 2005.

E N D
Snow to Liquid Ratio:Climatology and Forecast Methodologies Martin A. Baxter Cooperative Institute for Precipitation Systems Saint Louis University Dept. of Earth and Atmospheric Sciences LSX WFO Winter Weather Workshop 7 November 2005
Forecasting Winter Precipitation is a Two-Step Process • First, the current dynamic and thermodynamic forcings of the storm must be assessed. • Numerical model forecasts must be studied, especially the model quantitative precipitation forecast (QPF). • Second, the evolution of the hydrometeors from their origin to the surface must be predicted. • This evolution will be determined by the vertical profile of temperature and moisture. • This profile will elucidate the type of precipitation- rain, snow, freezing rain, ice pellets, or any combination. • If the precipitation is expected to fall as snow, a snow to liquid equivalent ratio must be determined to forecast the actual snow amount.
Why is liquid ratio important to forecasters? After forecasting liquid equivalent (QPF), the snow-liquid equivalent ratio must be estimated. Significant variations in snow to liquid equivalent ratio can occur even within a single storm system A more clear understanding of the processes that act to vary snow density will enable the forecaster to employ a more scientific process oriented method toward forecasting snowfall, versus commonly used empirical techniques. A challenge exists to determine the extent of interaction between the dynamical forcing and the microphysical processes that determine snow density (i.e., how efficient is the forcing in producing snowfall from a given amount of liquid equivalent?). SLR determines the wintertime precipitation efficiency
NWS “New Snowfall to Estimated Meltwater Conversion Table” (Kyle and Wesley 1996) • Utilizes surface temperatures to estimate snowfall from liquid equivalent • Is only marginally effective, as it does not account for geographic location or in-cloud microphysical processes.
Description of Dataset and Methods A 30 year (1971-2000) climatology of snow to liquid ratios was compiled using NWS Cooperative Observer Summary of the Day data. Only snowfalls greater than 2” and liquid equivalents greater than 0.11” were included, as this was the standard for Roebber et al. (2003). Estimated events were discarded. A station must have recorded at least 15 observations over the 30 year period to be included.
Average SLR for each NWS County Warning Area http://www.eas.slu.edu/CIPS/Research/snowliquidrat.html
Histogram for the Entire Dataset of SLR Mean: - 13.53 (Short dashed) 25th Percentile: - 9.26 Median: - 12.14 (Long dashed) 75th Percentile: - 16.67
Sample SLR Climatological Distributions 3674 Observations A very “average” distribution when compared to the histogram for the entire US Skewed to high values (0.33)
Ratio typically varies with storm track • Clipper type storms feature higher snow to liquid ratios, as they are colder and contain less moisture. • This leads to growth by deposition. • Storm tracks that are warmer or contain more Gulf moisture feature lower snow to liquid ratios. • This leads to growth by riming, possibly mixed with sleet. • Average SLR for southeastern Wisconsin with various storm tracks (Adapted from Harms, 1970 )
Ice Crystal Habits bullet simple plate solid column combination of needles dendrite hollow column crystal with broad branches combination of bullets sheath (Pruppacher and Klett 1980)
Crystal habit depends on temperature and degree of saturation (Magono and Lee, 1966)
Light Riming Ice Crystal Riming Supercooled water droplets impact the crystal as it falls If riming occurs late, crystals retain original form. If riming occurs early, the droplet can provide a nucleus for a new crystal. If riming is significant, graupel (soft hail can form). Heavy Riming (Photos from Libbrecht 2004)
Different crystal types will have different amounts of air in between them at the surface (More air = higher SLR) (Less air = lower SLR) Stellar / Dendritic crystals Graupel
Low Temperature Scanning Electron Microscope Photography A Graupel Particle – notice the lack of air space in the particle itself as well as the lack of air space that will result upon stacking A Dendritic Crystal – notice the air space in the crystal itself and the air space that will result upon stacking
Low Temperature Scanning Electron Microscope Photography Air space is reduced as a snowpack settles Air space is reduced even more as snow melts
Billings, MT ACARS Sounding (Libbrecht 2004) 30:1 SLR Observed (crystals like these?)
A Physically-Based Method Using Climatology • SLR is determined largely by the vertical temperature profile • Thus, the 30-year average SLR is likely associated with an average vertical temperature profile • An SLR value that is higher or lower than the 30-year average is presumably associated with an anomalous vertical temperature profile that is colder or warmer, respectively • For this study, 850 mb anomalies were used, with modifications made based upon the temperature profile below this level and the surface conditions. • Warmer temps – more riming – lower SLR values
Why must we use Climatology? • No correlations between atmospheric variables (temperature and humidity aloft and at the surface) and SLR have been established • Climatology provides an “initial guess” that can be refined by examining the details of the situation • Where is the maximum vertical motion? • What crystal types will form and how will they evolve? • Will significant riming occur? • How will the surface conditions impact the fallen snow? • This method shows how a forecaster can understand the processes that affect SLR, as well as providing a crude quantitative guess • Technique is being used at some NWS offices already (Billings, MT; Glasgow, MT)
Average SLR for 1200 UTC 22 November 1996 - 1200 UTC 23 November 1996 Aberdeen, SD & Lacrosse, WI marked (SLR on bottom, # of reports on top)
Meteograms for 1200 UTC 22 November 1996 - 1200 UTC 23 November 1996 ABR LSE Figure reads left to right
Temp at ABR for 1200 UTC 22 November 1996 - 1200 UTC 23 November 1996 -20 -16.5 -20 -20 -16.5 -16.5 -13.5 -13.5 -13.5 -10 -10 -8 -8 -8 -4 -4 0 -10 0 -4 -10 -8 -10 -13.5 -13.5 -10 -13.5 -13.5
Temp at LSE for 1200 UTC 22 November 1996 - 1200 UTC 23 November 1996 -20 -16.5 -20 -13.5 -16.5 -13.5 -10 -10 -8 -10 -8 -4 -4 0 0 -4 0 -4
850 mb Temperature Anomalies 00 UTC 23 November 1996 ABR • 9 °C cooler than average • 18 SLR vs. 13-14 Avg SLR for Fall
850 mb Temperature Anomalies 12 UTC 23 November 1996 LSE • 2 °C colder than average • 11 SLR vs. 12 Avg SLR for Fall • Difference due to warm ground temps and warm air in low levels
How do I find the 850 mb Temp Anomalies? Rich Grumm’s (SOO, State College) ensemble & anomaly page at Penn State University http://eyewall.met.psu.edu/ensembles/java/ModelDisplay.html
Other Methods for Forecasting SLR – Neural Network • Neural Network – Paul Roebber (UW-MW), Dave Schultz (NSSL) • Neural network is “trained” with conditions (temp, RH, etc.) associated with SLR values for many cases • Network is then able to predict SLR for new cases based upon the nonlinear relationships derived from the training data • “nonlinear” – an exponential relationship for example – changes in a given variable are not associated with changes of equal proportion in another variable • Crude treatment of vertical motion • Gives likelihood of SLR in one of 3 classes, no exact number given • Light – 27:1 (36:1 if > 67% probability) • Moderate – 13:1 (wins tie) • Heavy – 8:1
Most Important Factors in Forecasting SLR • Solar radiation (month) • Low- to midlevel temperature (> 850 mb) • Mid- to upper-level temperature (875-400 mb) • Low- to midlevel relative humidity (> 850 mb) • Midlevel relative humidity (850-700 mb) • Upper-level relative humidity (700-500 mb) • External compaction • RH information useful, but less essential • Function of neural network is to sort out the non-linearity • Behaves like a human brain – takes in new data and matches it to patterns it has “experience” with – even though the new data does not exactly match any of the old data
Verification of the Roebber Algorithm Neural network vs. surface chart % Snowfall forecast error (cm) 15.2 cm = 6” 4.0 cm = 1.5” 37 cases 2004-05
Other Methods for Forecasting SLR – Cobb Method • Cobb Method – Dan Cobb (SOO, WFO CAR) • Similar to a top-down approach to forecasting • Uses vertical motion information • Keys in on the Snow Production Zone (SPZ), where temperatures are -12 to -18 °C and the Bergeron process is maximized • Accounts for temporal evolution of SLR • Code is not complex and a gridded product has been created • Beneficial for forecasting responsibilities at both national and local/regional levels • Somewhat empirical, but also often accurate
The Cobb Method • Find max UVV in a cloudy layer (RH with respect to water > 75%) • Calculate a weighting factor to be applied to all layers that meet criteria • Although the concept is physically sound, the determination of the formulation of the weighting factor is highly empirical (and very important). • The layer with the highest vertical motion will contribute the most to the observed snow ratio • It will determine the dominant crystal type
The Cobb Method • Calculate a snow ratio for each model layer based on temperature Curve is generated via a cubic spline through 6 data points that are based on observations of SLR vs. crystal type by Ivan Dube (MSC) and from my climatology (this curve is also “bumped up” to account for extreme events) Is this curve accurate? Does “one size fit all”?
The Cobb Method 4. Use this formula to calculate the weighted contribution to the snow ratio for each layer: 5. Sum the results of this formula over all the layers to receive the predicted snow ratio
The Cobb Method – Sample Calculation 10 x 4% = 0.4 45 x 36% = 16.2 6 x 60% = 3.6 Weight = 4% 250m thick layer Weight = 36% 500m thick layer Weight = 60% 250m thick layer 20:1
The Cobb Method • Vertical motion max collocated with SPZ: • High rate of high ratio snowfall (dendritic) • Vertical motion max below the SPZ: • Warmer temps, more supercooled water leading to riming, lower ratio snowfall • Vertical motion max above the SPZ: • More difficult to discern resulting ratio, crystals fall through many layers resulting in different types of growth • Vertical motion is required to supply supercooled water in lower levels – thus the effects of riming are implicitly included • Crystals falling from aloft will deplete the liquid
Verification of the Cobb Method • For the 2001-2002 winter season (October-April) • 24 hour observations of SLR were paired with model vertical profiles where snowfall was observed during the 24 hour period • Using the 3 hourly, 32 km, Regional Reanalysis data • 25 mb vertical resolution below 700 mb, 50 mb above • 3 hourly Cobb SLR’s were summed to produce a daily total • Sources of error are considerable when doing point based verification • Bad SLR measurement • Reanalysis still not totally representative of real atmosphere • Compare 2 weighting functions – • Original (#1) – ωlayer/ωtotal • New (#2) – Previously discussed
Verification of the Cobb Method – Jan 31 2002 Cobb Method True Values
One More Method – Dube Method (MSC) • Makes the “top-down method” quantitative via a decision-tree styled algorithm • Verification of algorithm by Jessica Cox (McGill University) indicates the method performs equal to or better than the 10:1 approximation 83% of the time • Not currently available in the US http://meted.ucar.edu/norlat/snowdensity/from_mm_to_cm.pdf
Sample Case - Roebber Method • Using GFS • 40 km • Assumes all QPF snow • 24 hour snow total from 3 hourly SLR • Ending 12Z 10-26-05
Sample Case - Cobb Method • Using GFS • 40 km • Assumes all QPF snow • 24 hour snow total from 3 hourly SLR • Ending 12Z 10-26-05
Verification – 24 hr Snowfall Totals http://www.nohrsc.noaa.gov/nsa/ (NOHRSC)
A 30 year (1971-2000) climatology was completed for snow to liquid ratio • Average snow to liquid ratios are typically higher than 10:1; more like 13:1 for much of the country • Certain storm tracks will exhibit varying snow to liquid ratios based upon in-cloud temperatures and relative humidities. Time of year and external compaction also play dominate roles. • We can attempt to extract out the effects of microphysical interactions by determining the type of crystals that formed and how these crystals grew and changed. • In most cases it is possible to determine relative areas of higher and lower SLR values & obtain a crude estimate through use of low-level temp anomalies • Two new forecasting methods are being tested at HPC during the 2005-2006 winter weather experiment • These may become operational next season Snow to Liquid Ratio Overview