Download
1 / 22
220 likes | 678 Views
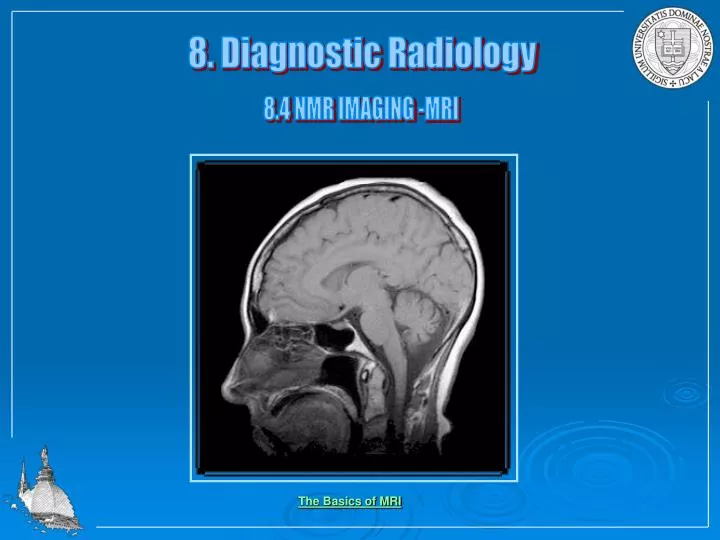
8. Diagnostic Radiology. 8.4 NMR IMAGING -MRI. The Basics of MRI. Current MRI technology displays images as multiple sets of gray tone images. Visualization and interpretation of the multiparameter images may be optimized by assigned color tissue segmentation. .

E N D
8. Diagnostic Radiology 8.4 NMR IMAGING -MRI The Basics of MRI
Current MRI technology displays images as multiple sets of gray tone images. Visualization and interpretation of the multiparameter images may be optimized by assigned color tissue segmentation.
Researcher H. Keith Brown, Ph.D. has developed technology that creates color composite images that indicate the unique physical and chemical properties of the human tissues represented by those images.
NMR imaging is a powerful technique to obtain high resolution images of comparable quality with CT scans without the disadvantages of possible radiation damage. The important aspects which determine the resolution and contrast in the final image are the bandwidth of the rf-signalwhich causes. The resonance absorption (excitation of spin-up protons to spin-down protons), the relaxation timescale for establishing the equilibrium value, and the field gradient Gin the external magnetic field Bj.
This loss process has an oscillatory exponential behavior: The actual T2relaxation is reduced to a true relaxation time T2* by field inhomogeneities and field gradients.
Typically T1 > T2 but the relaxation times typically depend of the particular kind of body tissue (influence of difference in proton density due to differences in molecular structure of body tissues)
MRI techniques use the differences in relaxation time to highlight different tissue materials and to obtain optimum contrast and resolution!
Different techniques are used for pulse sequences for the rf-signals. The rf-signal typically has a certain bandwidth around the Larmor frequency for the material to be observed. For medical MRI this is typically hydrogen. Two pulse sequence techniques are typically used; the saturation recovery sequence, SRS and the spin-echo sequence, SES. The SRSis comprised of a series of 90° pulses separated by a period of time (time of repetition TD) Each applied 90° rf-pulse rotates the magnetization from z-direction into the xy-plane, an antenna is used to pick up the signal (FID) induced by the change of magnetization. The oscillating (0)FID signal decays following the time constant ti before the next pulse occurs. Before complete relaxation has occurred (relaxation time T1a second 90° pulse follows.
The free induction signal (which contains many frequencies) is converted into absorption mode signal by Fourier transformation, it has a Lorentzian form:
In the SESthe 90° pulse is followed by an additional 180° pulse at a time TE/2 (TE echo time) to refocus the Mxymagnetization before the next 90° pulse occurs. This causes an additional echo signal. The signal for the SES image is described as a function of pulse repetition time TD and echo time TE: This equation allows to make the choice of scanning parameters TD and TE to emphasize the differences for T1and T2in different tissue materials. TD emphasizes the weighting of T1and TE emphasizes the weighting of T2.
The right choice of pulse repetition TD and echo-time TE allows to emphasize the T1relaxation time characteristics for different body tissues. Short TD emphasizes tissues with short relaxation times T1 like fat and blood, short TE minimizes T2 decay effects. Long repetition times TD emphasize tissues with long relaxation times T1 like cerebral tissues.
The relative intensity in the NMR signal for different body tissues can be calculated as a function of the relaxation times T1 and T2 for different choices of retardation time TD and echo-time TE. The relative intensity of a signal for body tissue i is: The contrast is determined by the difference in the relative signal intensity:
EXAMPLE: Compare the intensity of the MRI signal for a magnetic field strength of B0=1.5 T for cerebrospinal fluid (CSF) and gray matter (gm) and calculate the contrast in the MRI image. For a magnetic field strength of B=1.5 T the relaxation times for cerebrospinal fluid and for gray matter are: T1(CSF) = 2400 ms, T2(CSF) = 160 ms T1(gray matter) = 900 ms, T2(fat) = 100 ms
Nuclear Magnetic Resonance Image Acquisition Most of the MRI imaging methods are based on the fact that the resonant frequency is proportional to the field strength. Thus a small field gradient G = B/z is added along the axis of field B0, z which causes the resonance frequency 0to change with position z: If the resulting FID signal is Fourier transformed to obtain the frequency distribution, the frequency axis would be equivalent to the z-displacement. A field gradient Gss(slice-selection gradient) can be used to localize the MR excitation to a region within the body.
If the rf-pulse has only a small bandwidth (ss 1-2 kHz), only spins in a thin slice resonating at frequencies within that bandwidth would be excited (selective excitation). Each position zi corresponds to a resonance frequency0 The choice of field gradient and band width of the rf-pulse determines the slice thickness: A fixed gradient Gssallows to modify the slice thickness by changing the band width of the rf-signal. Typically, however, the band width is fixed and the gradient varies.
If an NMR facility has a field of B=2 Tesla and a gradient of G=0.01xB (T/cm) If the field is directed along the length axis of the head We can calculate the NMR Larmor frequency as a function of the position along that axis… w0= g.B + g.z.G where g= 42.58 MHz/T
So the equation becomes… w0= 85.16 + (0.85 x z) For z = 1.0 cm w0= 86.0 MHz For z = 5.0 cm w0= 89.4 MHz For z = 10.0 cm w0= 93.7 MHz
4.7 Tesla/33cm SISCO IMAGING SYSTEM This Scanner has a magnetic field of 4.7T and 200 MHz resonance frequency for protons. The shielded gradient coils and Oxford gradient power supply are able to produce a gradient field of 6.5 G/cm. The diameter of the space in the magnet bore available to users is 22 cm. The usual size of the objects for MR imaging is 14 x 14 x 14 cm.
Siemens 3 Tesla Magnetom Allega MR Headscanner The Siemens 3T Allegra is a state-of-the-art system designed especially for neurological and cognitive fMRI studies. The Allegra system provides a gradient strength of 40 mT/m and a slew rate 400 T/m/sec. It has excellent linearity across a 22 cm FOV. It will facilitate simultaneous optical and MR or eye-tracking and MR recording.
Varian 600 MHz Wide-Bore Spectrometer The Varian 600 MHz wide-bore system will be equipped for both high resolution NMR spectroscopy and microimaging. With gradients in place the clear bore of the magnet is 3.5 cm. Proton 5 mm and 10 mm probes are available for imaging studies. In addition, there are four receiver channels for the implementation of multiple coils, phased arrays and parallel acquisition schemes. High resolution and imaging software is available, with the identical operating system to the 4. 7 Tesla SISCO system.