Download

1 / 7
70 likes | 337 Views
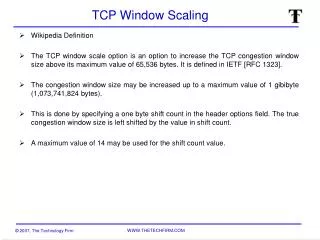
How to Display TCP Window Size using Sniffer and Excel. Taken from the ‘ Getting Techknowledgable Course’. TCP Window Size Concepts. One reason for poor performance or throughput can be seen by observing the TCP Window Size.

E N D
How to Display TCP Window Size using Sniffer and Excel. Taken from the ‘Getting Techknowledgable Course’
TCP Window Size Concepts • One reason for poor performance or throughput can be seen by observing the TCP Window Size. • When the Window size of the receiving station reaches Zero, the sending station will wait until the receiving station advertises a Window Size greater than Zero. • Reasons for Zero Window • Legacy Applications not recompiled for 16/32 bit operating systems • Poorly designed application • Overloaded station or Server • To eliminate an overloaded server, try other file transfer utilities [i.e. FTP] or observe if other application ports are having Window Zero symptoms. • Zero Windows may be followed with ‘Window Exceeded’ symptoms when the sending station sends 1 byte packets. • The ability to view the TCP Window, provides an idea if the application may no be efficient.
Step One: Filter Out All Packets except ACKS • The ACK packet from the receiver advertises the TCP WINDOW size. • We need to create a filter that only displays these packets. • Simply find a frame from the receiver acknowledging a packet. • These packets typically do not have SEQ identifiers, only ACK=. • After you find one packet, create a display filter with the following characteristics; • Anything only from the Receiver’s IP address and a pattern match for the ACK bit. • For Ethernet II encapsulation the offset is Hex 2F with a value of 10.
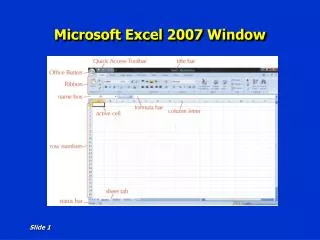
Step Two: Import to Excel • Now that you have a filtered display, export the data to Excel.
Step Three: Parse Data • The dilemma now is to parse the value from the test so we can graph it. • Of course there are many ways to skin a … well I won’t go there. You know what I mean. • This is one of many techniques to can use to parse the data from the numeric value.
Step Four: Parse Data cont.. • Select the entire column • Select Data->Text to Columns • Choose Fixed width • Draw a line after the ‘=‘.
Step Five: Graph as always. • You can graph the values as individual values, but may be a bit too granular for most. • I suggest you use the Data subtotal feature and graph the Window average per second. • Keep in mind that the frames may be more than a second apart.