Download
1 / 36
360 likes | 473 Views
Determination of Size Fractions and Concentrations of Airborne Particulate Matter Generated From Construction and Demolition Waste Processing Facilities. Facts. Over 320 million tons of C&D materials annually Over 3500 C&D processing facilities

E N D
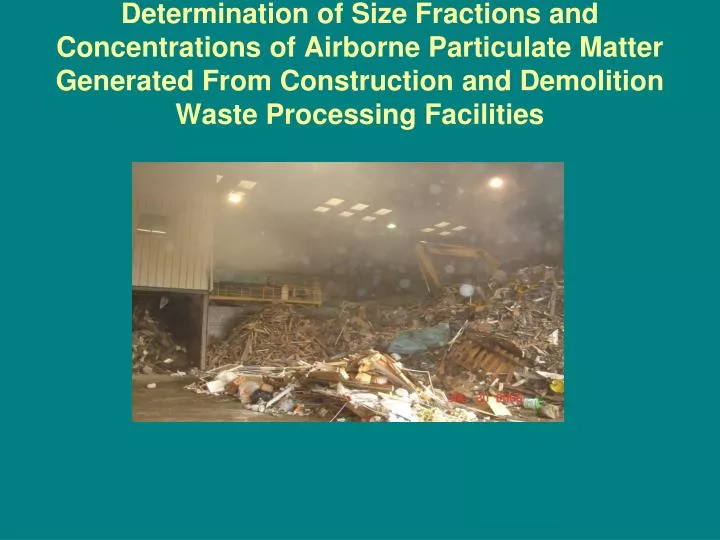
Determination of Size Fractions and Concentrations of Airborne Particulate Matter Generated From Construction and Demolition Waste Processing Facilities
Facts • Over 320 million tons of C&D materials annually • Over 3500 C&D processing facilities • Accept concrete, wood, gypsum, asphalt, shingles, glass, and steel • Material from construction, renovation, and demolition
Potential Impacts • Health • Aesthetics • Air quality • Manufacturing Equipment
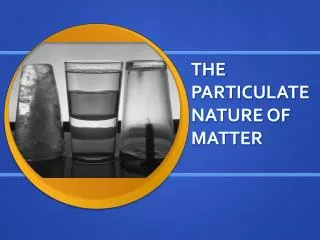
Particulate Matter of Interest • EPA Clean Air Act NAAQS • PM10-Course dust between 2.5 and 10 micrometers and fines • PM2.5-Fine particles less than 2.5 micrometers
National Ambient Air Quality Standards Units of measure for the standards are micrograms per cubic meter of air (µg/m3).Footnotes: (1) Due to a lack of evidence linking health problems to long-term exposure to coarse particle pollution, the agency revoked the annual PM10 standard in 2006 (effective December 17, 2006). (2) Not to be exceeded more than once per year on average over 3 years. (3) To attain this standard, the 3-year average of the weighted annual mean PM2.5 concentrations from single or multiple community-oriented monitors must not exceed 15.0 µg/m3. (4) To attain this standard, the 3-year average of the 98th percentile of 24-hour concentrations at each population-oriented monitor within an area must not exceed 35 µg/m3 (effective December 17, 2006).
PM10 and PM2.5 Sampling Methodology • Partisol® FRM Model 2000 Air Samplers
Particulate Matter of Interest • OSHA Nuisance Dust • Total Dust-All airborne particles • Respirable Dust-Small enough to penetrate deep into lungs
Occupational Safety and Health Administration Standards Footnote (1) The PELs are 8-hour TWAs unless otherwise noted; a (C) designation denotes a ceiling limit. They are to be determined from breathing-zone air samples. Footnote (a) Parts of vapor or gas per million parts of contaminated air by volume at 25 degrees C and 760 torr. Footnote (b) Milligrams of substance per cubic meter of air. When entry is in this column only, the value is exact; when listed with a ppm entry, it is approximate.
National Institute of Occupational Safety and Health Sampling Methodology • SKC AirliteTM Model 110-100 samplers
Facilities • Mid-Atlantic U.S. • Southeast U.S. • Northeast U.S.
Site A Overview • Located in mid-Atlantic U.S. • Receives MSW, C&D material, cardboard, and mixed recyclables • No grinding or mulching operations • No misting system in place nor do they spray down the waste stream • Receiving area and all roads are paved • Receiving area is indoors
Site B Overview • Located in southeastern U.S. • Receives C&D material and mixed recyclables • No grinding or mulching operations • Bale cardboard and plastic onsite • Manufacture ADC onsite • No misting system in place • Spray down the waste stream • Receiving area and all roads are paved • Receiving area is outdoors
Site C Overview • Located in northeastern U.S. • Receives C&D, MSW, concrete, wood, cardboard, metal, gypsum, and sheetrock • Mulching operation • Manufacture ADC onsite • Misting system in receiving area • Spray down the waste stream • Receiving area and most roads are paved • Receiving area is indoors
General Conclusions • Difficult to directly compare sites • Operational differences • Record keeping • Sampling limitations • Misting impacted results • Road Surface Impacts • Weather impacts • Waste volume impacts
General Conclusions • Facilities may exceed EPA standards • No OSHA exceedances • Particulates higher inside buildings • Particulates higher in areas of high activity
Recommendations to Reduce Particulate Levels at C&D Processing Facilities • Dust can be reduced in three ways: • Prevention • Control Systems • Dilution and Isolation