Download
1 / 15
150 likes | 174 Views
Block Diagrams. BIOE 4200. Interpreting block diagrams. Block diagrams are used as schematic representations of mathematical models The various pieces correspond to mathematical entities Can be rearranged to help simplify the equations used to model the system

E N D
Block Diagrams BIOE 4200
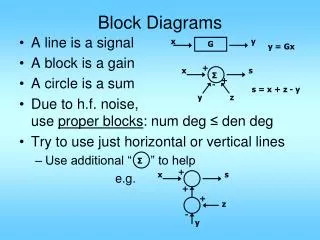
Interpreting block diagrams • Block diagrams are used as schematic representations of mathematical models • The various pieces correspond to mathematical entities • Can be rearranged to help simplify the equations used to model the system • We will focus on one type of schematic diagram – feedback control systems
Variables • Variables are represented by arrows in block diagrams • Variables correspond to a physical and measurable quantity • Example: suppose you’re modeling a process for producing a dye for clothing • You must have a way of quantifying the dye color! • Variables must have physical units • Actual speed units are MPH or km/hr • Blood glucose units are mg/dl
Physical units • Determining the physical units of some quantities is not a trivial task! • Example - setting the desired speed in the cruise control system • This is actually an electrical signal in volts, but can we still call it MPH? • It depends on what you’re looking at – how the vehicle speed will vary on a steep slope vs. the function of the cruise control electronics • What is the physical signal that encodes desired blood glucose levels in a and b cells?
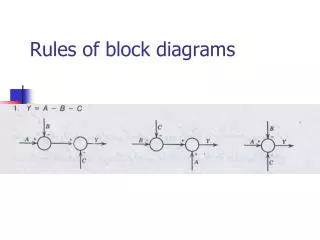
Process Output variable Input variable Processes • Processes are represented by the blocks in block diagrams: • Processes must have at least one input variable and at least one output variable • Reclassify processes without input or output: variable variable
Engine Processes • Most processes transform units: Accelerator depth (deg) Engine speed (rpm) glucagon (mg/dl) Glucose (mg/sec) Tissues insulin (mg/dl)
Processes • Processes can encompass sub-processes • A system is just a process w/ sub-processes! Actual glucose Measured glucose Glucagon a & b cells measure glucose a & b cells release hormones Insulin Actual glucose Glucagon a & b cell process Insulin
Measurement Processes • Processes that measure system outputs are called sensors • Input is physical property (MPH, mg/dl, etc.) • Output is electrical or mechanical signal • Typically model output to have units of input Actual speed Measured speed Speedo-meter
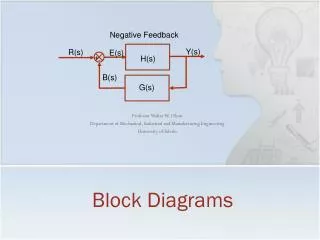
Feedback Control Systems • Many systems measure their output and use this measurement to control system behavior • This is known as feedback control – the output is “fed back” into the system • The summing junction is a special process that compares the input and the feedback • Inputs to summing junction must have same units! process input output sensor
Generic Feedback Control System • Input is the output we want the system to have • Summing junction subtracts the measured output from the desired output, difference is error signal • Controller acts based on magnitude of error signal • Actuator provides external power to system and effects changes based on controller output • Plant is the process we are trying to control desired output output controller actuator plant sensor
Generic Feedback Control System • This is a general model, and may not be the same for every feedback control system • Systems can have additional inputs known as disturbances into or between processes • Can combine processes; typically controller and actuator are combined • Describe and draw schematic, then recast your model into this form if possible desired output output controller actuator plant sensor
input: desired speed output: actual speed error: desired speed minus measured speed disturbance: wind, hills, etc. controller: cruise control unit actuator: engine plant: vehicle dynamics sensor: speedometer Cruise Control System Revisited wind, hills desired speed actual speed cruise control engine vehicle speedo-meter
input: desired blood glucose output: actual blood glucose error: desired minus measured blood glucose disturbance: eating, fasting, etc. controller: a and b cells actuator: glucose storing or releasing tissues plant: glucose metabolism sensor: a and b cells (again) Glucose Regulation Revisited eating, fasting desired glucose actual glucose a & b cells glucose tissues glucose metabol. a & b cells
Thermostat Example • Set thermostat to desired room temperature • Thermostat measures room temperature • Furnace or AC turn on if measured <> desired • Air from furnace or AC changes room air temperature external air desired temp. actual temp. thermo-stat furnace or AC room air thermo-stat
Toilet Flush Example • Float height determines desired water level • Flush empties tank, float is lowered and valve opens • Open valve allows water to enter tank • Float returns to desired level and valve closes flush desired level actual level float valve water tank float