Download
1 / 14
140 likes | 235 Views
NetBrain's dynamic map, rather than a telnet window, serves as the primary troubleshooting interface. Through the map, engineers have access to rich design information, live performance metrics, and a comprehensive baseline of historical network changes.

E N D
Troubleshoot with Maps & Apps Troubleshooting Slow Applications NetBrain Technologies 15 Network Drive Burlington, MA 01803 +1 800.605.7964 info@netbraintech.com www.netbraintech.com
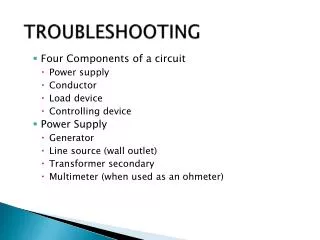
Map + App • Troubleshoot with automation • Instantly create a dynamic network map to identify the segment of the network responsible for forwarding the application traffic. Then drill down with apps for further diagnosis. Network Performance Routing Changes Configuration Discrepancies
Build a Map • Visualize the application flow across the network • with a targeted map created from a pair of source and destination addresses of the application
Asymmetric Routing • Map reverse flow path • to see how traffic flows from B to A.
Run Apps • Analyze application performance & design dependencies • by collecting performance and configuration data with an app. • Recommended App: Layer-4 Port-Level Analysis • Specify layer-4 protocol and port number to identify traffic forwarding rules and restrictions specific to defined port.
Run Apps • Discover changes in traffic flow • with an app to identify changes in topology by mapping the flow as it looked previously.
Run Apps • Monitor network health • by letting the app perform a continuous scan of the relevant network to determine device availability, device health, and link performance.
Run Apps • The app will also generate alarms when threshold is exceeded.
Run Apps • Leverage the Netflow app • to analyze bandwidth bottlenecks and drill down into interface’s bandwidth utilization data to see relevant Netflow data.
Write Your Own Apps • To automate any troubleshooting diagnosis • Create an app rather than issuing show commands one-by-one across devices.
Write Your Own Apps • Define variables of interest • One example is to use “show interface” IOS command to extract speed and duplex from each interface.
Write Your Own Apps • Define data positions on the map • Use the map to display the desired device and interface data.
Write Your Own Apps • Define alarm thresholds • Indicate a threshold condition and associated warning message when threshold is exceeded.
See NetBrain in Action Daily Demo • Join us for a 30-minute engineer-led demo. • Sign up here! Free Whitepaper Download a free whitepaper from our website. To Learn More… Free 30-day Trial Ready to start automating? Download a free trial of NetBrain’s Enterprise Suite from our website. NetBrain Technologies 15 Network Drive Burlington, MA 01803 www.netbraintech.com