Download
1 / 24
240 likes | 407 Views
UNIT 2: World population. Contents. How do we study population ? World population Population ageing Migration The population of Spain. Keywords. Generational replacement : reemplazo generacional. Ageing population : población envejecida. Developed countries : países desarrollados.

E N D
Contents • How do westudypopulation? • Worldpopulation • Populationageing • Migration • Thepopulation of Spain
Keywords • Generationalreplacement: reemplazo generacional. • Ageingpopulation: población envejecida. • Developedcountries: países desarrollados. • Healthcaresystem: sistema sanitario. • Refugee, displaced person: refugiados. • Migrationflows: flujos migratorios. • Net migration: saldo migratorio. • Migration / migración, emigrant / emigrante, immigrant / inmigrante. • Birthrate: tasa de natalidad. • Deathrate: tasa de mortalidad. - Fertilityrate: tasa de fertilidad. - Populationageing: envejecimiento poblacional. • Infantmortalityrate: tasa de mortalidad infantil. • Lifeexpectancy: esperanza de vida. • Therate of natural increase: tasa de crecimiento natural. • Populationdensity: densidad de población. • Migrationrate: tasa de migración. • Demographer: demógrafo. • Populationtrends: tendencias de la población.
1. How do westudypopulation? Migration rate is the difference between the number of persons entering and leaving a country during a year per 1000 people. The population density is the population per square kilometre. We also study population structure by age and gender of a given population during a year. The study of population in Geography came back to the 1960’s, but from this it has been very important. We use many indicators to study population. The birth rate is the number of live births occurring among of a given population area during a year, per 1000 people. The fertility rate is an estimate of the average number of children that a woman has during his lifetime. A minimum of 2.1 children per woman allows generational replacement to take place. The death rate is the number of deaths occurring among of a given population area during a year, per 1000 people. The infant mortality rate is the number of deaths of children under one year of age occurring in a given geographical area during a year, per 1000 of live births. Life expectancy is the average number of years that a person expects to live. The rate of natural increase is the difference between births and deaths.
Populationpyramids Population pyramids are used by demographers as a tool for understanding the make-up of a given population, whether a city, country, region, or the world. So what is a Population Pyramid? A Population Pyramid is a graph that shows the age-sex distribution of a given population. It a graphic profile of the population’s residents. Sex is shown on the left/right sides, age on the y-axis, and the percentage of population on the x-axis. Each grouping is called a cohort. It displays percentages and shows what portion of people fall into each cohort. Demographers use population pyramids to see population trends in the past, examine the current resident profile, and also to project how the population will increase/decrease in the future. The more rectangular the graph is shaped, the slower a population is growing; we see a more uniform population size across age groups. Old generations are being replaced by new generations of approximately the same size. The more a graph looks like a pyramid, the faster that population is growing; old generations are producing larger new generations. Another way to think of it is that the pyramid shape has a larger bottom than top; a larger percentage of the population are in their reproductive years or haven’t even reach reproductive age. As a result, there is much potential for growth. https://youtu.be/FTLbb0Z5lNg
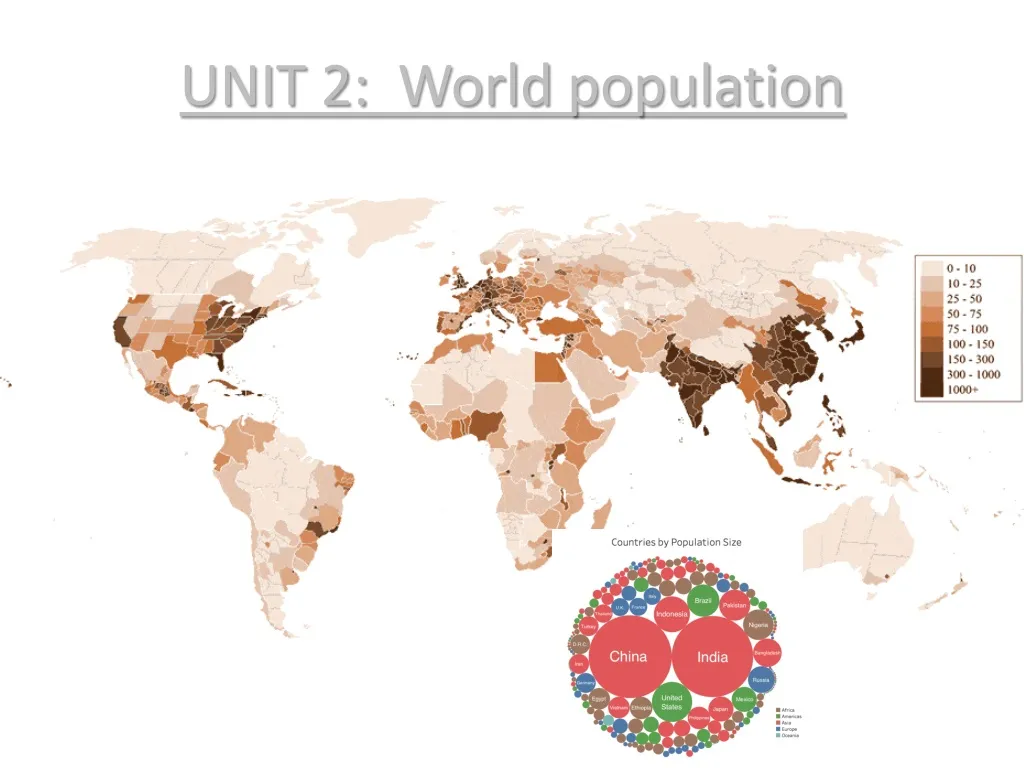
2. Worldpopulation Worldpopulationgrewveryslowlybeforethe 19th century. Birthrateswerehigh, butdeathrateswerealsohigh. In the 20th centurytherewasrapidincreasepopulationgrowth (populationexplosion). Today, theworld’spopulationis 7000 million. By 2050, itisexpectedtoreach 9000 million. Thebirth and fertilityrateshave fallen allaroundtheworldand thedeathrate decline in mostregions. Lifeexpectancy has risenbecause of advances in medicine and nutrition.
Worldpopulationtrends Developedcountrieshavelowpopulationgrowth, whichmeansthatthey are losingpopulation. Thesecountrieshavelowdeath and birthrates, as a resulttheyhaveanageingpopulation. Thebirhratedeclinedforthefollowingreasons: workingwomen, contraceptionavailableand social changingvalues. Lessdevelopedcountrieshave more dynamicpopulations. The natural rate of increaseisaround 2% and thebirthrateisveryhigh. Instead, thelifeexpectancyislow in lessdevelopedcountriesbecauseaccesstohealthcareorfreshwater as well as armedconflicts. In conclusion, thereis a youngpopulation in manyunderdevelopedcountries and overpopulationisgoingto be a problemforthosecountries.
3. Populationageing As you can see in the map (by World Health Organization) on the right populations are increasingly ageing today all across the world. The population of a region gets older because two main reasons: • The decline of fertility rate. • The increase of life expectancy. Whichregionshaveageingpopulations? In developedcountrieslifeexpectancyishigh and birthrateislow, as a resultthepopulations are ageing. In emergingcountrieslifeexpectancy has increased and, at thesame time, thebirthrate has fallen. In conclusion, thepopulationisgrowing in emergingconuntries. In lessdevelopedcountrieslowexpectancyislow and thebirthrateishigh. Thosecountrieshave a youngpopulation, usuallyonly 3% of thewholepopulationisaged 65 orover.
Theconsequences of populationageing Populationageing has veryimportanteconomic and social consequences: • Generationalreplacementdoesnottake place, populationfalls. • Statesneedtospend more onhealthcare, pensions and retirementhomes. • Olderpeopleoftenhavelowerincomes and save more. • Ageingpopulationsrequire more health and leisureservices. In youngpopulations, thereis a greaterdemandforconsumergoods and educationservices.
4. Migration Human migration is the movement by people from one place to another with the intentions of settling, permanently or temporarily in a new location. Emigration: an emigrant is a person who leaves their place of residence. Immigration: an immigrant is a person who arrives from somewhere else. People migrate for many reasons (economic, social, political or religious or natural disasters. A person who moves from their home to another place because of natural disaster or civil disturbance may be described as a refugee or, especially within the same country, a displaced person. A person seeking refuge from political, religious, or other forms of persecution is usually described as an asylum seeker.
Internal and internationalmigrations Internalmigration. In emerging and lessdevelopedcountriespeople moved from rural areastocities, lookingforjobs(rural exodus). In developedcountries, retiredpeoplesometimesleavecitiestolive in quiet places with a mildclimate. International migration. Todaypeopleemigratefromlessdevelopedcountriestoanemergingordeveloped country becausetheyneedworkforce. In developedcountries, manyinmigrants are unqualiffiedworkerswhoacceptsjobsthatthe local populationdoesnotwant. Retiredpeoplefromdevelopedcountriesmovetoanotherdevelopedcountriesthathave a betterclimate, economyorhealthcare. However, in times of economicrecession, peoplealsoemigratefromdevelopedcountries. Mostmigrants are youngadults, bothmen and women, unskilledorwithgoodqualifications, lookigfor a betterjobbetweencountriesthar are neareachotherorhave a similar culture.
Theconsequences of massmigration • Demographic. Emigrants are oftenyoungadults. Thecountriestheyleave lose youngpopulation, whilethecountriestheygogainyoungerpopulation. • Economic. Unemploymentfalls in a country wheremanypeoplemigrate and thoseemigrantssendmoney home totheircountries of origin. • Sociological. Manyinmigrantsfinditdifficulttoadapttotheir new countries. Sometimesis more difficultbyracistatititudes and xenophobia. • Cultural. Thearrival of peoplefromothercountriespromotes cultural interchange. • Environmental. In countrieswherepopulationgrowstooquickly, there are problems of polution, noise, provision of services… OCCUPY WALL STREET - MAY 1: A protesters sign that reads I Am An Immigrant I came to take your job, but you don’t have one
5. Thepopulation of Spain Thedynamics of thespanishpopulationpyramid shows clearlythatthispopulationisgettingageing. This will be a problem in the future, for example it is going to be impossible to pay pensions witin a few years and the budget of the healthcare system will increase dramatically:
Population distribution In 2014 Spain had 46.5 million inhabitants, this was 9’2% of the population of the European Union. Spain has been losing population since 2012 because negative net migration has not been balanced by natural growth. This population decline is expected to go on and it is estimated that Spain will have a population of 44’1 million inhabitants in 2023. Population is evenly distributed. Average density is 92 inhabitants per km2, but there are many differences between one region and another. In general, the interior of the peninsula has the lowest population density, especially Castilla-La Mancha and Castilla y León, Extremadura and Aragon. The most densely populated areas are the coast, Balearic and Canary Islands, Ceuta, Melilla and Madrid.
Low population growth The natural growth of Spain’s population is vey low, at just over 0’1%. Both birth rate (9’1%) and death rate (8’3%) are low. As in other developed countries, the birth rate will continue to fall. Spain has low proportion of women of childbearing age (15-49 years), fewer immigrants are coming to Spain, which means that fewer children are born. At the same time, emigration from Spain to other countries is increasing. The National Intitute od Statistics predicts a slight increase in the fertility rate from 1’34 to 1’41 children per woman. An ageing society The population of Spain id gradually ageing as a result of the falling birth rate and high life expectancy (83 years). This will have major economic, social and cultural consequences. Population ageing became significant by the late 1980’s, today the population age over 64 is 18%, ehile the population aged under 15 is 15%. This trend will continue in the future.
Migration flows Spain has always been a country of emigrants. The last large-scale emigrations were in the 1950’s and 1960’s, but after the recession of 1973 many people returned. In the late 20th century the trend changed and Spain became a country of immigration. Since 2010 immigration has declined as a consequence of the economic crisis. There are fewer job opportunities for immigrants, and many immigrants have returned to their countries of origin. At the same time, there has been an increase in emigration to other countries, especially by qualified young people looking for a work. As a result, there was negative net migration in Spain in 2013 (-256.849 people), and the country’s total population fell.
HOMEWORK!!! 1. Define thefollowingterms: Lifeexpectancy, populationageing, fertilityrate, populationdensity, rural exodus, net migrationrate. 2. Explaintheconsequences of populationageing: • Demographic: • Social: • Economic: 3. Explainwidelythispopulationpyramid:
6. Describe populationtrends in anunderveloped country. 7. Describe populationtrends in a highlydeveloped country. 8. Describe generationalreplacement. 9. Explainclearlytheconsequences of migrations. 10. Explainclearly and deeplytheconsequences of populationageing. 11. Describe internationalmigrations and rural exodus. 12. Describe thepopulation of Spainnowadays. Describe alsomigrations in Spain.
Made by Francisco Javier AbadesAnsián History teacher at Castilla y León (Spain) Feel free to study or share this presentation


