Download

1 / 30
300 likes | 309 Views
National Population Projections and the challenges of an ageing population. Helen Bray and Shayla Goldring ONS. National population projections - key points. Rising fertility, rising life expectancy and record levels of net migration Big increase in projected total population size

E N D
National Population Projections and the challenges of an ageing population Helen Bray and Shayla Goldring ONS
National population projections - key points • Rising fertility, rising life expectancy and record levels of net migration • Big increase in projected total population size • Population ageing
Data availability • National population projections data remain on the GAD website: www.gad.gov.uk • Data to be moved to NS Online during 2008
How are assumptions decided? • Analysis of demographic trends • Expert advisory panel • Formal consultation • Assumptions agreed by ONS and devolved administrations
Annual mortality improvement, 2006 - 2007 UK male/female comparison
Period and cohort expectations of life at birth, UK, 1981 - 2056
Projected elderly demographic support ratio, UK, 2006 - 2056
Percentage of the UK population aged 65 and over, variant projections, 1981 - 2056
Challenges of an ageing population - Outline • Background • Implications of population ageing • Health • Social Services • Housing • Labour Force • Pensions • Well being • Future work
Background Population age structure, UK Source: ONS: Censuses 1971-2001; National Population Projections 2011-2031
Background Percentage of population aged 60 and over, 2004- 2031 Source: Eurostat 2004 based population projections
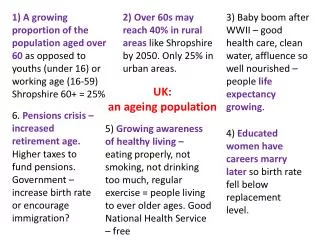
Implications Ageing will have an impact on the following areas: • Health – increasing demand for GP and hospital care • Social Services – increasing demand for long term care • Housing – ‘new homes must cater for ageing’ 26/1/2008 • Labour force – increasing number of older workers • Pensions – increasing state pensions bill • Well being/social cohesion ..however, the size of the effects are interrelated with changing trends in living arrangements, partnership status and also policy intervention
Living arrangements Women Men Age 75 and over 65–74 45–64 25–44 1986/87 1986/87 16–24 2005 2005 0 10 20 30 40 50 60 70 80 70 60 50 40 30 20 10 0 Percentages Percentages People living alone, by sex and age: 1986/87 and 2005, Great Britain Source: ONS: General Household Survey (Longitudinal)
Partnership status Females aged 65 and over by partnership status, 2003-2031, England and Wales Source: ONS: 2003 based Marital Status Projections 2003-2031
Percentage of women with no children or only one child at age 45, by birth cohort, England and Wales Completed family size Source: ONS: Vital events registration data and General Household Survey data.
Employment Average age of the working age population (16-SPA), 1971-2031, UK Note: Includes changes to State Pension Age Source: ONS: Mid-year population estimates, 1971-2006; National Population Projections 2011-2031
Summary • UK not ageing as fast as EU on average • Still important to prepare for larger numbers and greater proportionate share of population at older ages in UK • Need for more information and also co-ordinated and coherent reporting
ONS Future work on ageing • Quantifying the demographic drivers of ageing • Inequalities in age at retirement • How are trends in family formation and dissolution likely to affect the proportion of family members providing care? Other parts of ONS • How much are we saving for retirement? Are we saving enough? • Health at older ages
Contacts • National projections and the ageing population • NPP Branch – chris.shaw@ons.gov.uk – 020 7533 5294 • or– natpopproj@ons.gov.uk – 020 7533 5222 • Ageing Unit – shayla.goldring@ons.gov.uk –01329 813212 • Morbidity and health care - chris.white@ons.gov.uk – 01633 455865 • Pensions Analysis Unit - chris.daffin@ons.gov.uk–01633 816198