Download
1 / 39
400 likes | 598 Views
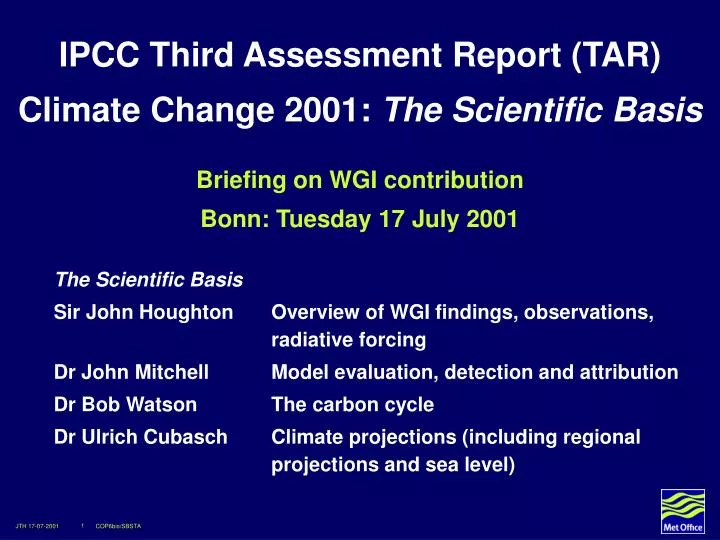
IPCC Third Assessment Report (TAR) Climate Change 2001: The Scientific Basis. Briefing on WGI contribution Bonn: Tuesday 17 July 2001. The Scientific Basis Sir John Houghton Overview of WGI findings, observations, radiative forcing Dr John Mitchell Model evaluation, detection and attribution

E N D
IPCC Third Assessment Report (TAR)Climate Change 2001: The Scientific Basis Briefing on WGI contributionBonn: Tuesday 17 July 2001 The Scientific Basis Sir John Houghton Overview of WGI findings, observations, radiative forcing Dr John Mitchell Model evaluation, detection and attribution Dr Bob Watson The carbon cycle Dr Ulrich Cubasch Climate projections (including regional projections and sea level)
IPCC Website http://www.ipcc.ch
Structure of IPCC 1997 - 2001 United Nations WMO UNEP COP/FCCC World Climate Programme IGBP Global Climate Observing system etc Subsidiary bodies of the framework convention on climate change IPCC IPCC Bureau WGII Impacts and adaptation WGI Science WGIII Mitigation Lead Authors, Contributors, Reviewers
Climate Change 2001: The Scientific BasisWGI contribution to IPCC Third Assessment Report Summary for Policymakers (SPM) Drafted by a team of 59 Approved ‘sentence by sentence’ by WGI plenary (99 Governments and 45 scientists) 14 chapters 881 pages 120 Lead Authors 515 Contributing Authors 4621 References quoted
Key steps in preparation of Working Group I (science) component of Third Assessment Report Bad Munsteriefel Scoping Meeting Vienna Shanghai VII VIII WORKING GROUP I SESSION LEAD AUTHORS MEETING TS / SPM DRAFTING INFORMAL REVIEW EXPERT REVIEW GOVERNMENT REVIEW Paris Arusha Auckland Victoria Shanghai 1 2 3 4 5 New York 1998 1999 2000 2001
Variations of the Earth’s surface temperature for the past 140 years SPM 1a
Variations of the Earth’s surface temperature for the past 1,000 years SPM 1b
Concentration of Carbon Dioxide and Methane Have Risen Greatly Since Pre-Industrial Times Carbon dioxide: 33% rise Methane: 100% rise BW 5 The MetOffice. Hadley Center for Climate Prediction and Research.
700 The last 160,000 years (from ice cores) and the next 100 years CO2 in 2100 (with business as usual) 600 Double pre-industrial CO2 Time (thousands of years) 500 Lowest possible CO2 stabilisation level by 2100 400 CO2 concentration (ppmv) CO2 now 300 10 Temperature difference from now °C 200 0 –10 100 160 120 80 40 Now
The Greenhouse Effect Solar radiation Long-wave radiation
The Enhanced Greenhouse Effect S L 236 236 S L 236 232 S L 236 236 S L 236 236 Solar (S) and longwave (L) radiation in Wm-2 at the top of the atmosphere T = -18°C CO2 x 2 + Feedbacks H2O (+60%) Ice/Albedo (+60%) Cloud? Ocean? CO2 x 2 CO2 x 2 TS = 15°C TS = 15°C DTS ~ 1.2K DTS ~ 2.5K
Changing Land Use Changing land use could influence atmospheric CO2 concentration. Hypothetically, if all of the carbon released by historical land-use changes could be restored to the terrestrial biosphere over the course of the century (e.g., by reforestation), CO2 concentration would be reduced by 40 to 70 ppm.
Main climate changes • Sea level rise • Higher temperatures - especially on land • Hydrological cycle more intense • Changes at regional level
Sea-level transgression scenarios for Bangladesh Adapted from Milliman et al. (1989).
Percent of the continental USA with a much above normal proportion of total annual precipitation from 1-day extreme events (more than 2 inches or 50.8mm) BW 7 Karl et al. 1996
El Niño years La Niña years The 1997/98 El Niño Strongest on Record* BW 14 *As shown by changes in sea-surface temperature (relative to the 1961-1990 average) for the eastern tropical Pacific off Peru
Global ocean circulation Cooling Warm surface current Intermediate waters Warm and less saline Antarctic circumpolar current A simplified view of the global thermohaline conveyor belt, showing cooling and downwelling in the North Atlantic, warming and freshening in the southern hemisphere, and return flow as a warm surface current.
UNITED NATIONS FRAMEWORK CONVENTION ON CLIMATE CHANGERio de Janeiro : June 1992ARTICLE 2: OBJECTIVE The ultimate objective of this Convention .... is to achieve, .… stabilization of greenhouse gas concentrations in the atmosphere at a level that would prevent dangerous anthropogenic interference with the climate system. Such a level should be achieved within a time-frame sufficient : • to allow ecosystems to adapt naturally to climate change. • to ensure that food production is not threatened, and • to enable economic development to proceed in a sustainable manner.