Download
1 / 89
990 likes | 1.71k Views
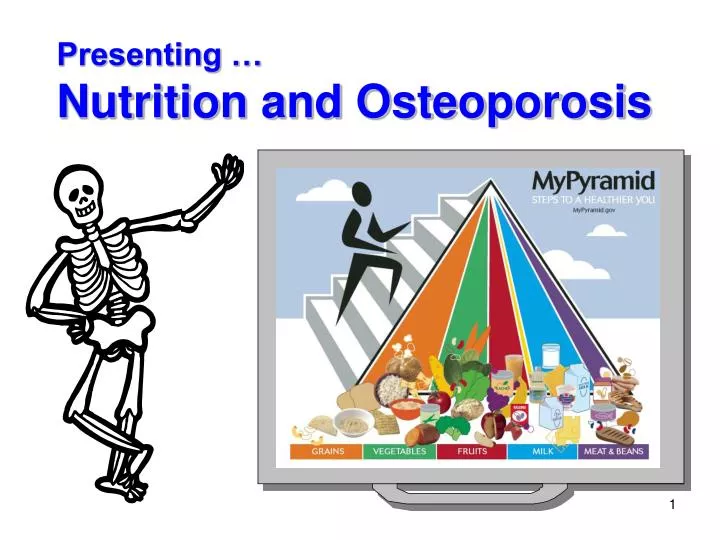
Presenting … Nutrition and Osteoporosis. Alice Henneman, MS, RD Linda Boeckner, PhD, RD University of Nebraska –Lincoln Extension. updated July 2005.

E N D
Alice Henneman, MS, RDLinda Boeckner, PhD, RDUniversity of Nebraska–Lincoln Extension updated July 2005 Extension is a division of the Institute of Agriculture and Natural Resources at the University of Nebraska-Lincoln cooperating with the counties and the U.S. Department of Agriculture.
Disclaimer The following information on nutritional aspects of osteoporosis is provided as information for general healthy eating. It should not be considered a substitute for seeking dietary advice from your own healthcare provider. Calcium and Vitamin D recommendations are based on those developed for the United States and Canada. They may not be appropriate for all countries due to differing dietary patterns and environmental factors.
Typical comments from people with osteoporosis “I’ve lost six inches in height and none of my clothes fit me anymore. Plus, it’s hard to get clothes that look nice when my back is so hunched over.”
Comments “What will I do if I have to give up driving?”
Comments “Medications are expensive. But I can’t afford to let my condition get worse and this medicine will help stop or slow down the bone loss.”
Comments “If somebody had told me sooner what I know now about osteoporosis, none of this might be happening to me!”
Today’s presentation . . . • Overview • Risk factors • Prevention steps • Food and supplement labels • Recommended calcium &vitamin D • Percent Daily Value ofcalcium in common foods • Additional dietary considerations • Help for the lactose-intolerant • If you don’t like to “drink” milk • Calcium supplements • Putting it all together
Overview Osteoporosis causes weak bones. In this common disease, bones lose minerals like calcium. They become fragile and break easily. Normal Bone Bone with Osteoporosis Source: The 2004 Surgeon General’s Report on Bone Health and Osteoporosis: What It Means to You at http://www.surgeongeneral.gov/library/bonehealth
Osteoporosis can strike at any age! It is a myth that osteoporosis is only a problem for older women.
The problem in America • Major health threat for an estimated 44 million (55%) of people 50 years and older • 10 million estimated to have osteoporosis • 34 million have low bone mass placing them at risk • 1 in 2 women and 1 in 4 men over 50 will have an osteoporosis-related fracture Source: National Osteoporosis Foundation Web site; retrieved July 2005 at http://www.nof.org
A woman’s hip fracture risk equals her combined risk of breast, uterine and ovarian cancer. Source: National Osteoporosis Foundation Web site; retrieved July 2005 at http://www.nof.org
Hip fractures account for 300,000 hospitalizations annually. People who break a hipmight not recover formonths or even years. Source: The 2004 Surgeon General’s Report on Bone Health and Osteoporosis: What It Means to You at http://www.surgeongeneral.gov/library/bonehealth
1 in 5 people with a hip fracture end up in a nursing home within a year. Some people never walk again. Source: The 2004 Surgeon General’s Report on Bone Health and Osteoporosis: What It Means to You at http://www.surgeongeneral.gov/library/bonehealth
Source: The 2004 Surgeon General’s Report on Bone Health and Osteoporosis: What It Means to You at http://www.surgeongeneral.gov/library/bonehealth
The “silent disease” • Often called the “silent disease” • Bone loss occurs without symptoms • First sign may be a fracture due to weakened bones • A sudden strain or bump can break a bone
The most common breaks in weak bones are in the wrist, spine and hip. Source: The 2004 Surgeon General’s Report on Bone Health and Osteoporosis: What It Means to You at http://www.surgeongeneral.gov/library/bonehealth
Bones are living organs • Calcium is deposited and withdrawn from bones daily. • Bones build to about age 30. • We need to build up a healthy bone account while young and continue to make deposits with age.
After mid-30’s, you begin to slowly lose bone mass. Women lose bone mass faster after menopause, but it happens to men too. • Bones can weaken early in life without a healthy diet and the right kinds of physical activity. Source: The 2004 Surgeon General’s Report on Bone Health and Osteoporosis: What It Means to You at http://www.surgeongeneral.gov/library/bonehealth
Risk factors If you have any of these “red flags,” you could be at high risk for weak bones. Talk to your health care professional. Source: The 2004 Surgeon General’s Report on Bone Health and Osteoporosis: What It Means to You at http://www.surgeongeneral.gov/library/bonehealth
1 • I’m older than 65 • I’ve broken a bone after age 50 • My close relative has osteoporosis or has .broken a bone • My health is “fair” or “poor” • I smoke • I am underweight for my height
2 • I started menopause before age 45 • I've never gotten enough calcium • I have more than two drinks of alcohol .several times a week • I have poor vision, even with glasses • I sometimes fall • I'm not active
I have one of these medical conditions: • Hyperthyroidism • Chronic lung disease • Cancer • Inflammatory bowel disease • Chronic liver or kidney disease • Hyperparathyroidism • Vitamin D deficiency • Cushing's disease • Multiple sclerosis • Rheumatoid arthritis 3
4 I take one of these medicines: • Oral glucocorticoids (steroids) • Cancer treatments (radiation, chemotherapy) • Thyroid medicine • Antiepileptic medications • Gonadal hormone suppression • Immunosuppressive agents
The good news: Osteoporosis is preventable for most people! • Start building healthy bones while young. • Healthy diet and lifestyle are important for BOTH men and women.
Simple Prevention Steps The National Osteoporosis Foundation (NOF) recommends FIVE simple steps to bone health and osteoporosis prevention …
Step 1 Get your daily recommended amounts of calcium and vitamin D. Use MyPyramid.gov to help plan an overall healthy diet
Step 2 Engage in regular weight-bearing exercise. Even simple activities such as walking, stair climbing and dancing can strengthen bones.
12 oz. 5 oz. 1.5 oz. Step 3 Avoid smoking and excessive alcohol. MyPyramid.gov recommends no more than 1 drink per day for women and 2 for men.
Step 4 Talk to your doctor about bone health.
Step 5 Have a bone density test and take medication when appropriate. Source of photo: USDA ARS Photo Unit Photo by Peggy Greb Testing is a simple, painless procedure.
Food and supplement labels Assess calcium and vitamin D intake by using food and supplement labels.
Nutrition labels & calcium • FDA uses “Percent Daily Value” (% DV) to describe amount of calcium needed by general U.S. population daily • 100% DV for calcium = 1,000 mg • Look for this label: • “Nutrition Facts” on foods • “Supplement Facts” on vitamin/mineral supplements
Example of “Daily Value” If a food or supplement has 200 mg of calcium per serving, the “Nutrition Facts” or “Supplement Facts” panel shows: 20% DV for calcium(200 mg ÷ 1,000 mg = 20%)
Example: Calculating total % DV for calcium from “Nutrition Facts” labels Food% DV Fruit yogurt 35% Oatmeal 10% Nachos 20% Turnip greens 15% Total % DV = 80% Source: “Calcium! Do You Get It?, ” FDA/CFSAN at http://www.cfsan.fda.gov/~dms/ca-toc.html
Using Nutrition Facts “serving size” • Serving size on “Nutrition Facts” panel based on what people typically eat—it’s not a recommended amount. • Adjust calcium % DV if you eat a different serving size than on label. • Example: If label says a half cup serving provides 4% DV, one cup provides 8% DV
Calcium Vitamin D Recommended daily calcium & vitamin D
Calcium requirements vary by age Growthspurt Source: The 2004 Surgeon General’s Report on Bone Health and Osteoporosis: What It Means to You at http://www.surgeongeneral.gov/library/bonehealth
600 IU 600 500 400 IU 400 200 IU 300 200 100 0 up to 50 51-70 over 70 You need more vitamin D as you age Daily vitamin D needs inInternational Units (IU) Age
It’s important to remember … Some age groups need MORE or LESSthan 100% DV for calcium and vitamin D. • Calcium requirements vary by age: • More is needed as we grow older • Need is highest during rapid growth of adolescence. • Vitamin D requirements increase as we age. • 100% DV for calcium and Vitamin D are based on 1,000 mg calcium and 400 IU vitamin D.
Some age groups need MORE or LESSthan 100% DV for calcium and vitamin D Calcium & vitamin D recommendations • Birth - 6 months210 mg calcium(21% DV)200 IU vitamin D (50% DV) • 6 months - 1 year270 mg calcium (27% DV)200 IU vitamin D (50% DV)
Some age groups need MORE or LESSthan 100% DV for calcium and vitamin D Calcium & vitamin D recommendations • 1 - 3 years500 mg calcium (50% DV)200 IU vitamin D (50% DV) • 4 - 8 years800 mg calcium (80% DV)200 IU vitamin D (50% DV)
Some age groups need MORE or LESSthan 100% DV for calcium and vitamin D Calcium & vitamin D recommendations • 9 - 18 years1,300 mg calcium (130% DV)200 IU vitamin D (50% DV) • 19 - 50 years1,000 mg calcium (100% DV)200 IU vitamin D (50% DV)
Some age groups need MORE or LESSthan 100% DV for calcium and vitamin D Calcium & vitamin D recommendations • 51 - 70 years1,200 mg calcium (120% DV)400 IU vitamin D (100% DV) • 71 and older1,200 mg calcium (120% DV)600 IU vitamin D (150% DV)
Some age groups need MORE or LESSthan 100% DV for calcium and vitamin D Calcium & vitamin D recommendations Pregnant & Lactating • 14 - 18 years1,300 mg calcium (130% DV)200 IU vitamin D (50% DV) • 19 - 50 years1,000 mg calcium (100% DV)200 IU vitamin D (50% DV)
Upper daily limits: calcium & vitamin D The National Academy of Sciences (1997) suggests the following tolerable daily upper intake levels (UL) from foods and supplements combined: • Calcium: The UL for 1 year and older (including pregnant and lactating women) is 2,500 mg/day. It was not possible to establish an UL for infants under age 1. • Vitamin D: No higher than 50 mcg (micrograms) or 2,000 IU for ages 1 and over; 25 mcg (1,000 IU) for 0 to 12 months • The National Osteoporosis Foundation recommends limiting Vitamin D to 800 IU/day unless your doctor prescribes it.
Percent Daily Value (DV) of calcium in common foods Approximate % DV for foods based in part on The 2004 Surgeon General’s Report on Bone Health and Osteoporosis: What It Means to You at http://www.surgeongeneral.gov/library/bonehealth
An easy way to meet calcium needs is consuming 3 cups (8 oz.) each day of fat-free or low-fat* milk or equivalent milk products in combination with a healthy diet. Children ages 2–8 years need 2 cups. • MyPyramid equivalents: • 8 oz. milk • 1 cup yogurt • 1-1/2 oz. natural ..or 2 oz. processed ..cheese * Fat-free and low-fat are for health but not for calcium differences