Download
1 / 70
790 likes | 1.13k Views
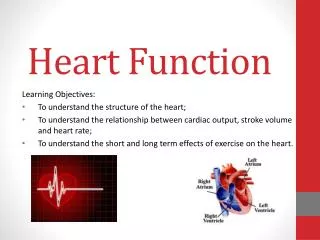
Heart Rate Variability to Assess Autonomic Function. Phyllis K. Stein, Ph.D. Research Assistant Professor of Medicine and Director, HRV Lab Washington University School of Medicine, St. Louis, MO. PART I. Understanding ECGs and How the Heart Works. Overview of Blood Circulation.

E N D
Heart Rate Variability to Assess Autonomic Function Phyllis K. Stein, Ph.D. Research Assistant Professor of Medicine and Director, HRV Lab Washington University School of Medicine, St. Louis, MO
PART I Understanding ECGs and How the Heart Works
The Heartbeat Valves Valves
Action Potential Basics Resting voltage Resting voltage 1 2 3 4 5
Autonomic Nervous System Effects on the Heart Parasympathetic Nervous System (PNS), inhibits cardiac action potentials Sympathetic Nervous System (SNS), stimulates cardiac action potentials
Single Channel Normal ECG QRS complex t wave p wave
Atrial Premature Contraction (APC) Early QRS Abnormal p wave
Normal ECG with Ventricular Premature Contractions (VPCs) VPCs
Right Bundle Block (RBB) Wide QRS peak
Atrium Ventricle SA node AV node ECG Components P wave QRS complex T wave Sympathetic Nervous System Parasympathetic Nervous System Vagal APC or SVE Bigeminy VPCs VT VF Keywords
PART II Holter and Other Continuous ECG Data
Heart Rate Variability (HRV) Lab Analyzes Data from Continuous Electronically-Stored ECGs Cassette Tape Holter Monitor 2 or 3 channels of Simultaneous ECG signals Flash Card Patient wearing a Holter device.
Continuous ECG Data Also Obtained from Overnight Sleep Studies • Sleep studies have many channels of data including ECG • Data stored on a hard disk and file exported to a CD • One channel is ECG
Analysis of Stored ECG Signals • Continuous ECG signal is digitized and loaded on the Holter scanner • Holter scanner is a computer with special commercial software that can process ECGs • Many other computer algorithms exist that can display and measure things from ECGs
The Job of the Holter Scanner • Read and display the stored ECG • Identify the peak of each beat • Accurately label each beat as normal, APC or VPC • Measure the time between the peaks of each beat • Create a report describing the recording • Export the results as a “beat file”
The QRS File • MARS scanner exports “QRS” files. • QRS file is a list of every detected event on the tape, with the time after the next event. • Events can be normal beats, APCs, VPCs or just noise. • QRS file is in binary format, so we need to convert it to something we can read.
Digitized ECG Format • .MIT Format • Binary format • Consists of a .HDR file and .SIG file • .RAW file • Binary format • Does not contain any header info • Can be reloaded onto MARS like tape • .NAT file • Actual file on MARS • Can be reloaded into MARS “slot” and restore all original data and analyses
The .MIB file • QRS file from the MARS scanners are saved to “HRV.” • “HRV” is the name of the Sun computer that does all HRV calculations. • QRS file is converted to MIB file and stored on “HRV.” • .MIB= machine-independent beatfile • Heart rate variability is calculated from the .MIB file
Example of the Beginning of a .MIB File • # 13:46:03.726 • Study code=8050MJP OK,1 • Record number code=8050MJP1 • Start time=13:41:00 • First beat=13:46:03.726 • Start date=02-May-03 • Samples per second=128 • Marquette conversion date=Thu Jun 10 13:19:17 2004 • Marquette hardware revision=508 833 523 4.00 0.25 • End header • Q0.000000000 • Q687.500000000 • Q617.187500000 • Q656.250000000 • Q656.250000000 • Q656.250000000 • Q648.437500000 • Q656.250000000 • Q656.250000000 • Q687.500000000 • Q625.000000000 • Q656.250000000 • Q656.250000000 • Q656.250000000 • Q656.250000000 header
Files Generated from the .MIB File • All heart rate variability calculations are made and exported to an EXCEL spreadsheet with one row per subject • Heart rate tachograms -beat-by-beat plots of heart rate vs. time • HRV power spectral plots - graphical representation of HRV • HRV Poincaré plots - graphical representations of HR patterns
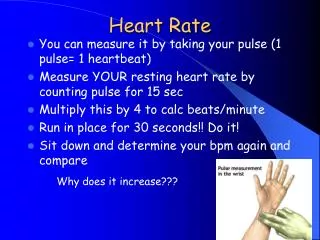
0-100 bpm “x-axis” Heart Rate Tachogram • x-axis = time in minutes (0-10 minutes) • y-axis for each 10-min plot is H (0-100 bpm in 5 cm) • “x-axis” is mean HR for that 10-min segment
Hourly Poincaré plots (much reduced in size)
Holter Scanner Beat file QRS File Binary .MIB Header Recognize: Tachograms Power spectral plots Poincaré plots Keywords
Part III HRV in Detail
Background (HRV) • Decreased heart rate variability • Abnormal heart rate variability • Identify patients with autonomic abnormalities who are at increased risk of arrhythmic events.
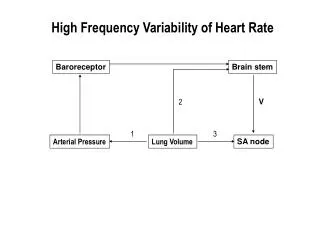
Parasympathetic Nervous system Heart Rate Cardiac output Blood pressure Renin angiotensin system Sympathetic Nervous system Simplified Model of Cardiovascular Autonomic Control
How HRV Reflects the Effect of the Autonomic Nervous System of the Heart
HR Fluctuations • Fluctuations in HR (HRV) are mediated by sympathetic (SNS) and parasympathetic (PNS) inputs to the SA node. • Rapid fluctuations in HR usually reflect PNS control only (respiratory sinus arrhythmia). • Slower fluctuations in HR reflect combined SNS and PNS + other influences.
Rapid Fluctuations in HR Are Vagally Mediated • “Rapid” fluctuations in HR are at >10 cycles/min (respiratory frequencies) • Vagal effect on HR mediated by acetylcholine binding which has an immediate effect on SA node. • If HR patterns are normal, rapid fluctuations in HR are vagally modulated
Acetylcholine Binding The Acetylcholine Neurotransmitter binds to a receptor on a muscle once released from a neuron.
Slower Fluctuations in HR Reflect Both SNS and Vagal Influences • “Slower” fluctuations in HR are <10 cycles per min. • SNS effect on HR is mediated by norepinephrine release which has a delayedeffect on SA node • Both SNS and vagal nerve traffic fluctuate at >10 cycles/min, but the time constant for changes in SNS tone to affect HR is too long to affect HR at normal breathing frequencies.
Sympathetic activation takes too long to affect RSA NE blinds to the beta-receptor (Alpha subunit of G-protein). After binding, G protein links to second messenger (adenyl cyclase) which converts ATP to cAMP. cAMP activates protein kinase A which breaks ATP to ADP+phosphate which phosphorylates the pacemaker channels and increases HR
Assessment of HRV Approach 1 • Physiologist’s Paradigm HR data collected over short period of time (~5-20 min), with or without interventions, under carefully controlled laboratory conditions.
Assessment ofHRV Approach 2 Clinician’s/Epidemiologists’s Paradigm Ambulatory Holter Recordings usually collected over 24-hours or less, usually on outpatients. Approaches 1 and 2 can be combined
HRV Perspectives Longer-term HRV-quantifies changes in HR over periods of >5min. Intermediate-term HRV-quantifies changes in HR over periods of <5 min. Short-term HRV-quantifies changes in HR from one beat to the next Ratio HRV-quantifies relationship between two HRV indices.
Sources of Heart Rate Variability • Extrinsic • Activity - Sleep Apnea • Mental Stress - Smoking • Physical Stress • Intrinsic Periodic Rhythms • Respiratory sinus arrhythmia • Baroreceptor reflex regulation • Thermoregulation • Neuroendocrine secretion • Circadian rhythms • Other, unknown rhythms
Ways to Quantify HRV Approach 1:How much variability is there? Time Domain and Geometric Analyses Approach 2: What are the underlying rhythms? What physiologic process do they represent? How much power does each underlying rhythm have? Frequency Domain Analysis Approach 3: How much complexity or self-similarity is there? Non-Linear Analyses