Download
1 / 63
680 likes | 1.03k Views
Glycemic Targets in Clinical Practice: Postprandial vs Preprandial and Fasting?. Steven D Wittlin MD University of Rochester School of Medicine and Dentistry Rochester, New York.

E N D
Glycemic Targets in Clinical Practice: Postprandial vs Preprandial and Fasting? Steven D Wittlin MD University of Rochester School of Medicine and Dentistry Rochester, New York
In all affairs it’s a healthy thing now and then to hang a question mark on the things you have long taken for granted…… Bertrand Russell
The question is not whether to target postprandial, preprandial or fasting glycemia, but when, how, and to what goals.
UKPDS Epidemiologic Data in Type 2 DiabetesNo A1C Threshold Adjusted incidence per 1000 person-years 80% Myocardial infarction 70% Microvascular endpoints 60% 50% 40% 30% 20% 10% 0% 5 6 7 8 9 10 11 Updated mean A1C (%) Stratton IM, et al. BMJ. 2000;321:405-412.
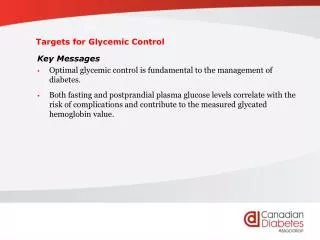
What are appropriate goals? • HbA1c • FPG • 2 hr PPG • Normalization of Glycemia
What is Normal? HbA1c <6.0% FPG <100 mg/dl (5.5 mM) 1 hr PPG <162 mg/dl (9.0 mM) 2 hr PPG <126 mg/dl (7.0 mM) (N=15) Woerle HJ et al . Am J Physiol 290:E67-E77, 2006
Hyperglycemia is a continuous risk factor for CVD... Therefore normality should be the goal if it can be safely achieved
CDA: HbA1C<7% “ consider targets in the normal range for patients in whom it can be achieved safely..” ADA: “...for patients in general is an A1C<7%....for the individual patient is an A1C as close to normal (<6.0%) as possible without significant hypoglycemia..” ADA, Diabetes Care 29:S4-S42, 2006. CDA, Can J Diabetes 27:S1-S151, 2003
To achieve a normal or near normal HbA1c, both FPG and PPG levels must be normal or near normal. Thus both FPG and PPG must be targets for therapy Nevertheless, might there be situations in which it is preferable to treat one or the other first ???
Patients With Type 2 Diabetes May Spend More Than12 Hours per Day in the Postprandial State Postprandial Postabsorptive Fasting Duration of postprandial state Breakfast Lunch Dinner Midnight 4 AM Breakfast 8 AM 11 AM 2 PM 5 PM Adapted from Monnier L. Eur J Clin Invest. 2000;30(suppl 2):3-11.
r=0.97 Correlation between plasma glucose levels after OGTT and standard mixed meal Wolever TMS et al. Diabetes Care 1998;21:336–40
Changes in Postprandial Glucose Metabolism in Type 2 DM • Use triple isotope technique and indirect calorimetry • DM pts had: • increased overall glucose release • Increased gluconeogenesis and glycogenolysis • ~90% of the increased glucose release occurred in the first 90 min post-prandial • In DM glucose clearance and oxidation were reduced • Non-oxidative glycolysis was increased • Net splanchnic glucose storage was reduced ~ 45% d.t. increased glycogen cycling Woerle HJ et al Am J Physiol Endocrinol Metab 2006
Relationship between HbA1C, FPG and 2 h. PPG Van Haeften T et al Metabolism 2000
Relative Changes in FPG and 2-h PG as HbA1c Increases 250 = HbA1c versus 2hppg = HbA1c versus FPG Plasma Glucose (mg/dL) 160 r = 0.55 y = 47.1 x -109 r = 0.48 y = 12.0 x +30 70 4 5 6 7 HbA1c (%) Woerle HJ et al Arch Intern Med. 2004;164:1627-1632.
In Individuals with HbA1C <6.5%, Postload Dysglycemia Predominates Woerle HJ et al Arch Intern Med. 2004;164:1627-1632.
As Patients Get Closer to A1C Goal, the Need to Successfully Manage PPG Significantly Increases Adapted from Monnier L, Lapinski H, Collette C. Contributions of fasting and postprandial plasnma glucose increments to the overall diurnal hyper glycemia of Type 2 diabetic patients: variations with increasing levels of HBA(1c).Diabetes Care. 2003;26:881-885.
Post-Prandial Hyperglycemia Antecedes Fasting Hyperglycemia Monnier L et al Diabetes Care 30:263-269, 2007
Characteristics # of patients Gender Age BMI FPG 2hPPG Mean HbA1C 6.0-6.5 6.6-7.0 37 16 14/23 8/8 54.6 49.6 27.8 27.9 111 113 (p=0.88) 198 226 (p=0.03) 6.26 6.73 PPG, but not FPG distinguishes patients with HbA1C Between 6.0-7.0% HbA1C Group (%) Woerle HJ et al Arch Intern Med. 2004;164:1627-1632.
Relative risk for death increases with 2-hour blood glucose irrespective of the FPG level 2.5 2.0 1.5 1.0 0.5 0.0 Hazard ratio ³11.1 7.8–11.0 2-hour plasma glucose(mmol/l) <7.8 <6.1 6.1–6.9 ³7.0 Fasting plasma glucose (mmol/l) Adjusted for age, center, sex DECODE Study Group. Lancet 1999;354:617–621
Effect of Acarbose on CVD in Patients with IGT ( STOP-NIDDM) ( Chiasson J - L et al JAMA July 2003 )
Controlling Postprandial Glucose • Prospective trial of fasting vs pc control in 164 pts w/ Type 2 DM • Forced titration to target either FBS < 100 or 90 min pc < 140 • Results: • HbA1C fell from 8.7 % to 6.5% • Only 64% of patients achieving FPG < 100 reached HbA1C < 7% • 94% of patients w/ pc < 140 reached HbA1C < 7% • Decreased pc BG accounted nearly twice as much as FBS for fall in HbA1C • If HbA1C < 6.2% , pc accounted for ~ 90% • If HbA1C > 8.9%, pc accounted for ~ 40% Woerle HJ et al in press
Relationship Between HbA1c, FPG and PPG in Treated T2DM Patients Major HbA1c (%) FPG (mM) PPG (mM) Problem 5 5.1 7.0 - 6 6.3 8.4 PPG 7 7.5 9.8 PPG 8 8.7 11.2 FPG+PPG 9 9.9 12.6 FPG+PPG 10 11.1 14.0 FPG Woerle et al., 2006.
So How Can We Assess Post-Prandial Glucose Control Clinically ?? • Frequent fingersticks • HbA1C • Fructosamine • Continuous Glucose Monitoring Systems • Historical • Real-time • 1,5 Anhydroglucitol
Postprandial Index vs. A1C/1,5-AG Assay Ratio *Postprandial Index is the conglomerate multivariable analysis using AUC-180 and post-meal maximum glucose values as the independent variables. • A1C/1,5-AG Ratio Correlated Better than A1C or 1,5-AG independently to the Postprandial Index • Combination of 1,5-AG and A1C are more predictive of postprandial hyperglycemia Dungan K et al Diabetes Care; June 2006
Approaches/Agents That Address Postprandial Hyperglycemia • Meglitinides • Alpha-Glucosidase Inhibitors • Prandial Insulin • GLP-1 analogues • DPP-IV inhibitors • Pramlintide • Glycemic Index/Load
Importance of Post-Prandial Control in Managing Gestational Diabetes de Veciana M et al NEJM Nov 1995
Nateglinide Monotherapy: Effect on Plasma Glucose and Insulin Pretreatment Nateglinide Glucose (mg/dL) Insulin (pmol/L) Time (hr) Time (hr) Hollander PA, et al. Diab Care 24:983-988, 2001.
Adding Prandial Insulin to Basal Therapy Further Improves HbA1C Davies M et al Tt.Lantus study group; ADA 2006 Abstract
Inhaled Insulin is Superior to Metformin as Add-on Therapy to Sulfonylureas !! Barnett AH et al. Diabetes Care 29:1282-1287, 2006
Fasting Plasma Glucose Reflects Endogenous Glucose Production Dinneen S, Gerich J, Rizza R. N Engl J Med. 1992;327:707-713
Why Fix Fasting First? Safer Simpler Lowering FPG first will lower all PG values throughout the day and thus will also reduce PPG and may be sufficient.
Effect of Glyburide or NPH Insulin on Glycemia in Type 2 Diabetes Time of day From: Shapiro ET et al. J Clin Endocrinol Metab69 (1989), pp. 571–576 Cusi K et al Diabetes Care18 (1995), pp. 843–851
Agents that Address Fasting Hyperglycemia • Basal Insulin • Metformin • Sulfonylureas • TZDs??
Pioglitazone Affects both FPG and PPG Miyazaki Y et al .Diabetes Care 25:517-523, 2002
Insulin Glargine vs NPH Insulin Added to Oral Therapy Patient Demographics • 756 insulin-naïve patients with type 2 diabetes • Insulin glargine n=367 • NPH n=389 • Mean age 55 yr • BMI 32 kg/m2 • Duration of diabetes 8-9 yr • Baseline A1C 8.6% Riddle MC et al and the Insulin Glargine 4002 Study Investigators. DiabetesCare 2003:26:3080-3086.
Insulin Glargine vs NPH Insulin Added to Orals Riddle MC et al and the Insulin Glargine 4002 Study Investigators. DiabetesCare 2003:26:3080-3086.
Insulin Glargine vs NPH Insulin Added to Oral Therapy Results ITT Analysis Insulin Glargine NPH FPG, mg/dL 117 120 mM 6.5 6.68 A1C, % 6.96 6.97 Final A1C 7% (% patients) 57 57 Nocturnal Hypoglycemia Patients,* % 40 49 Events, † no. 532 886 Severe Hypoglycemia Patients, % 2.5 2.3 *P<0.01; †P<0.002 Riddle et al and the Insulin Glargine 4002 Study Investigators. Diabetes Care 2003:26:3080-3086.
Exenatide vs Glargine in Type 2 Diabetes Mellitus • 551 patients, multi-site international study • Rx w/ Metformin and SU for 3 months prior to screening • HbA1C 7.0-10.0 % ; BMI 25-45 • Randomly assigned exenatide or glargine • Exenatide 10 mcg BID • Glargine titrated to FBS< 100mg/dl Results: HbA1C reduced by 1.16 and 1.14% respectively (Mean final HbA1C ~ 7%) Heine RJ et al Ann Int Med 2005; 143: 559-569
Exenatide vs Glargine in Type 2 Diabetes Mellitus glucose Time Heine RJ et al Ann Int Med 2005; 143: 559-569
Addressing Fasting vs Postprandial First Approach Overall Goals: • HbA1c <7 • FPG <100 mg/dl (5.5 mM) • PPPG (90 min) <140 mg/dl (7.8 mM) Woerle HJ et al in press
Fix Fasting First Algorithm Step 1: If FPG >100 mg/dl (5.5 mM) : a) drug naïve, start metformin b) if on SU, add metformin c) if on SU+Met, DC SU, add HS NPH Step 2: When FPG near goal, but PPPG >140 mg/dl (7.8 mM) : a) add repaglinide with meals b) if above unsuccessful in achieving PPG goal, DC and use regular insulin with meals. Woerle HJ et al in press
Demographic Characteristics Woerle HJ et al in press
Effects of Intensified Treatment Regimens (N=164) Woerle HJ et al in press
Cases of Hypoglycemic Episodes before and after Intensification of Treatment (N=164) Woerle HJ et al in press
Diurnal Plasma Glucose Profiles Before and After Intensified Therapy Intervention in Subjects Who Did and Did Not Achieve HbA1C < 7.0% % 220 = HbA1c > 7% = HbA1c < 7% 200 180 160 (mg/dL) 140 120 Mean ± SEM (N = 164) 100 6 8 10 12 14 16 18 20 22 24 Time (Hours) Woerle HJ et al Diabetes Res Clin Pract. 2007 Jan 19