Download
1 / 55
570 likes | 1.46k Views
Bivariate data. Bivariate data – Graphical & statistical techniques. Graphical techniques Scatter-plot Difference-plot Residual-plot Krouwer-plot Influences on the plots (data-range; subgroups; outliers; scaling) Influences of random- and systematic errors on the plots Linearity

E N D
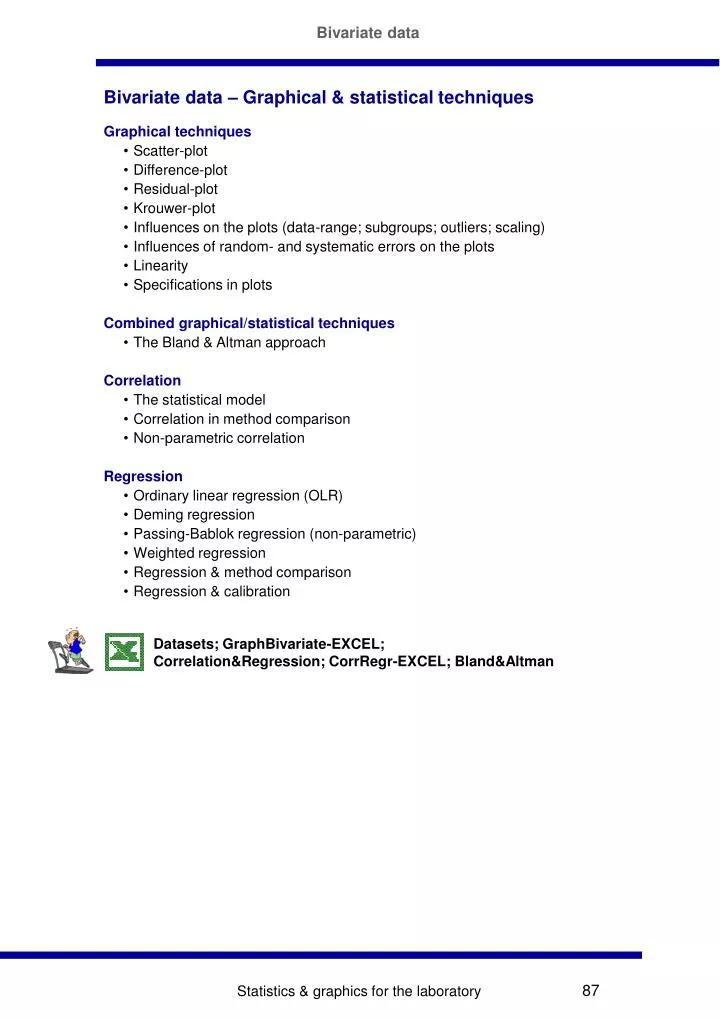
Bivariate data Bivariate data – Graphical & statistical techniques • Graphical techniques • Scatter-plot • Difference-plot • Residual-plot • Krouwer-plot • Influences on the plots (data-range; subgroups; outliers; scaling) • Influences of random- and systematic errors on the plots • Linearity • Specifications in plots • Combined graphical/statistical techniques • The Bland & Altman approach • Correlation • The statistical model • Correlation in method comparison • Non-parametric correlation • Regression • Ordinary linear regression (OLR) • Deming regression • Passing-Bablok regression (non-parametric) • Weighted regression • Regression & method comparison • Regression & calibration Datasets; GraphBivariate-EXCEL; Correlation&Regression; CorrRegr-EXCEL; Bland&Altman Statistics & graphics for the laboratory
Graphical techniques The scatter-plot • Construction of the axes • x-axis: comparative method (A) • y-axis: test method (B) • line of equality ( y = x ): - - - • The absolute difference plot • Construction of the x-axis • Hierarchically higher (A) and lower method (B) • x-axis: hierarchically higher method (A) • Hierarchically equivalent methods • x-axis: (A + B)/2 • Construction of the y-axis • y = B - A Usually, both axes extendfrom 0 to the highest result – y-axis is freely scalable – x-axis bisects the y-axis at 0 Statistics & graphics for the laboratory
Graphical techniques The percent (%) difference plot • Construction of the x-axis • Hierarchically higher (A) and lower method (B) • x-axis: hierarchically higher method (A) • Hierarchically equivalent methods • x-axis: (A + B)/2 • Construction of the y-axis • y = [(B - A)/A]x100, or[(B - A)/0.5x(A +B)]x100 • The residuals plot • Construction of the axes • x-axis: comparison method (A) • y-axis: regression (OLR) residuals: yi - ŷ – y-axis is freely scalable – x-axis bisects the y-axis at 0 – y-axis is freely scalable – x-axis bisects the y-axis at 0 Statistics & graphics for the laboratory
Graphical techniques The Krouwer plot (for the % bias) • Construction of the axes • x-axis: %-bias • y-axis: “folded” cumulative percentage • Construction of the Krouwer plot • "Folded cumulative percentage" Statistics & graphics for the laboratory
Graphical techniques Characteristics of the plots • Scatter plot (with the line y = x) • Simple construction: the same for methods with the same/different hierarchy • Good overview about the data through the comparison with the y = x line • “Difference” plots (absolute, %, residuals) • y-axis is freely scalable • Construction depends on method hierarchy • The residuals plot can only be constructed with knowledge of regression data • Not a pure graphical technique, but: useful for the judgement of linearity (shown later) • Krouwer plot • Gives an overview about the general distribution of errors • Information is lost about the concentration-dependency of errors • Graphical presentation of a method comparison • First conclusion • There are several different types of graphics for the interpretation of method comparison studies • The residuals- and the Krouwer plot are useful for the interpretation of special aspects of a method comparison (linearity, respectively, error distribution) • The scatter plot (y = x included) and the absolute and %-difference plot give the best overview about method comparison data • More detailed investigation with those 3 • Influences on the plots • Range of the results • “Subgroups” • Outliers • Scaling of the axes Statistics & graphics for the laboratory
Datasets-MethComp Graphical techniques Influence of the range • -Graphical resolution of the scatter plot: worse than the bias plots. • -The resolution of the scatter plot can be improved by an insert. • -Graphical resolution of the scatter plot: worse than the bias plots. • -Scatter plot: improve resolution by an insert or logarithmic scale. • Don't expect that "one size fits all" Statistics & graphics for the laboratory
Graphical techniques Subgroups • Note: y-axis of the difference plot is freely scalable! Therefore, its graphical resolution, usually, is better than the one of the scatter plot • A “subgroup” is easier to see in the %-difference plot than in the scatter plot Outliers • Glucose“normal” • Glucose“withoutliers” • Outliers have no influence on the resolution of the scatter plot, but reduce the resolution of the difference plots. • Scatter plot more robust than difference plots Statistics & graphics for the laboratory
Graphical techniques Scaling • y-scaling … Effect… • A: "as the data are" Good resolution, but x- & y-axis • cannot be compared directly • B: free Good/poor agreement • can be manipulated graphically • C: identical (graphical distance) Loss of resolution, • x and y scaling but better direct comparison possible • Graphs and errors • Random errors • SD constant (small range; e.g., sodium) • CV constant (medium range; e.g., glucose) • SD/CV variable (wide range; e.g., estradiol) Common situation CV constant/SD decreasing down to a certain concentration, then SD constant and CV increasing Statistics & graphics for the laboratory
Graphical techniques Graphs and errors • Systematic errors -Constant -Proportional -Combination (constant/proportional) -Non-linearity • Graphs and errors • Examples • Systematic errors • y = x • y = 1.1 • x • y = x + 1 • Random errors • General examples withCV = 2% and SD = 0.1 Statistics & graphics for the laboratory
Graphical techniques Graphs and errors • What could be noted? • For case 1: y = x • Better resolution of the difference plots • Scatter plot • At constant CV, typical V-form of the random error limits • At constant SD, parallel limits for random error • Absolute difference plot • At constant CV, typical V-form of the random error limits • At constant SD, parallel limits for random error • %-difference plot • At constant CV, parallel limits for random error • At constant SD, typical hyperbolic limits for random error Statistics & graphics for the laboratory
Graphical techniques Graphs and errors • What could be noted? • (additionally to y = x) • A large proportional error • Deteriorates the resolution of the absolute difference plot • Has no influence on the %-difference plot • A large constanterror • (as compared to the random error) • Has no influence on the absolute difference plot • The hyperbolic error limits in the %-difference plot become “one-sided” • Summary • The difference plots, generally, have a better resolution than the scatter plot • The scatter plot is robust against all sorts of errors The limits for random error are • V-shaped (constant CV) • parallel (constant SD) • The absolute difference plot is robust against constant errors, but sensitive to proportional errors (loss of resolution) The limits for random error are • V-shaped (constant CV) • parallel (constant SD) • The %-difference plot is robust against proportional errors, • but sensitive towards constant errors The limits for random error are • parallel (CV constant and no constant error), • 2-sided hyperbolic (SD constant and no const. error), or • 1-sided hyperbolic (existence of a relatively big constant error) Statistics & graphics for the laboratory
Graphical techniques Linearity • Judgement of linearity • Consider the following ways • Best with regression (residuals plot) • For a broad range • Logarithmic • Easier with a logarithmic plot • Conclusion: "no size fits all" Statistics & graphics for the laboratory
Graphical techniques Specifications • Specifications are needed for the interpretation of a method comparison. • We look for specifications in • The scatter plot • The absolute difference plot • The %-difference plot • The scatter plot The absolute difference plot The %-difference plot Statistics & graphics for the laboratory
Graphical techniques Specifications • "Error grid analysis" (glucose) • Summary • The scatter plot is useful for all sorts of specifications The limits for specifications (around y = x) are • parallel (absolute specification) • or V-shaped (% specification) • The absolute difference plot is most appropriate for absolute specifications The limits for specifications (around 0) are • parallel (absolute specification) • or V-shaped (% specification) • The %-difference plot is most appropriate for % specifications The limits for specifications (around 0) are • parallel (% specification) • 2-sided hyperbolic (absolute specification) • Annex • More examples • Examples sorted according to plot-type Statistics & graphics for the laboratory
Exercises GraphBivariate-EXCEL • This file is a template for a • Scatter plot (with line of equality) • Absolute bias plot (x-axis with hierarchichally higher method, only) • % bias plot (x-axis with hierarchichally higher method, only) • Absolute bias plot (x-axis with average x&y) • % bias plot (x-axis with average x&y) • Residuals plot • It may be adapted to the needs of the user. • This file can also be used to reproduce most of the plots in this tutorial by using the datasets in: Datasets(Method comparison: Sodium, Glucose, Estradiol) Statistics & graphics for the laboratory
Graphical techniques Annex – More examples Statistics & graphics for the laboratory
Graphical techniques Statistics & graphics for the laboratory
Notes Notes Statistics & graphics for the laboratory
Combined graphical/statistical techniques Combined graphical/statistical techniques • The Bland&Altman approach for the interpretation of method comparison studies • References • Altman DG, Bland JM. Measurement in medicine: the analysis of method comparison studies. Statistician 1983;32:307-17. • Bland JM, Altman DG. Statistical methods for assessing agreement between two methods of clinical measurement. Lancet 1986;307-10. • Bland JM, Altman DG. Measuring agreement in method comparison studies. Stat Methods Med Res 1999;8:135-60. • Approach • The goal of the Bland & Altman approach is to compare the outcome of method comparison studies in terms of systematic (SE) and total error (TE) with quality specifications for systematic (SEspec) and total error (TEspec). • Calculations • This requires the following calculations (note: the B&A symbols are used here) • -Mean difference (đ) and its 95% confidence limits (CL) (equivalent to SE) • -1.96 SDdiff and its CL (equivalent to TE) • SDdiff = standard deviation of the differences between the methods • Those are to be compared with the specifications in the following way: • đ ± CL SEspec and • 1.96 SDdiff ± CL TEspec, • Graphics • At the same time, Bland&Altman recommended to present the data in an absolute bias plot including the lines for đ and 1.96 SDdiff. Original plot Adapted from: Bland JM, Altman DG. Lancet 1986;i:307-10. Statistics & graphics for the laboratory
Combined graphical/statistical techniques Combined graphical/statistical techniques • Limitations of the original plot • Does not recognize different method hierarchies • Same hierarchy: x = (A+B)/2 Different hierarchy: x = A • In many cases a %-bias plot is more appropriate. In that connection, it is better to calculate the 1.96 CV values, because the SD is often increasing with the level, so that no mean SD exists. • Does not include confidence limits • Does not include TE/SE-specifications Statistics & graphics for the laboratory
Combined graphical/statistical techniques Combined graphical/statistical techniques • Remember: Quality specifications in the • Absolute bias plot %-bias plot • Limitations of the original plot • Does not recognize different method hierarchies • In many cases a %-bias plot is more appropriate • Does not include confidence limits • Does not include TE/SE-specifications • Because of these limitations, it is recommended to use an "extended" Bland&Altman plot (see next page) • See also following references • Stöckl D. Beyond the myths of difference plots [letter]. Ann Clin Biochem 1996;33:575-7. • Dewitte K, Fierens C, Stöckl D, Thienpont LM. Application of the Bland-Altman plot for the interpretation of method-comparison studies: a critical investigation of its practice. Clin Chem 2002;48:799-801. • Stöckl D, Rodríguez Cabaleiro D, Van Uytfanghe K, Thienpont LM. Interpreting method comparison studies by use of the bland-altman plot: reflecting the importance of sample size by incorporating confidence limits and predefined error limits in the graphic. Clin Chem 2004;50:2216-8. Statistics & graphics for the laboratory
Combined graphical/statistical techniques Bland & Altman plot – Expanded • Recommendations • Construct the x-axis according to the hierarchy of the methods • Choose a bias-plot (absolute, %) that fits your data • Use the "extended" version of the plot (+specifications and CL's) • (the 1-sided limits are chosen because the comparison is versus a specification). • Be aware of the meaning of the calculated estimates "mean" bias or "mean" SD/CV • This file contains a template for the Bland&Altman plot with pre-programmed confidence limits and entries for the SE and TE specifications. It may be adapted to the needs of the user. Bland&Altman Statistics & graphics for the laboratory
Notes Notes Statistics & graphics for the laboratory
Notes Notes Statistics & graphics for the laboratory
Correlation and Regression Correlation and Regression • Correlation • The statistical model • Correlation in method comparison • Non-parametric correlation • Regression • Ordinary linear rgression (OLR) • Deming regression • Passing-Bablok regression (non-parametric) • Weighted regression • Regression & method comparison • Regression & calibration Statistics & graphics for the laboratory
Correlation Correlation and regression • Correlation • Correlation concerns association between variables, e. g. serum cholesterol and indicators of heart disease. • Correlation is a descriptive measure that does not allow conclusions concerning causal relationships. • Correlation is also used together with regression (method comparison studies) • Comparison Correlation <> Regression • Regression model: one variable (the dependent variable, y) is a function of another variable (the independent variable, x) • Example: Blood pressure may be considered a function of age • Correlation model: both variables are random effects factors • Example: Human arm and leg lengths are correlated • Univariate and multivariate correlation • Univariate (simple): between two variables • Multivariate: between several variables and an outcome measure, e.g. between serum cholesterol and triglyceride and an indicator of heart disease • Univariate correlation and relationships of data • Linear relationship (often implicitly assumed) • A curvilinear relationship, e.g. a polynomial model • Cyclical relationship • Linear correlation – Computations • Pearson´s product – moment correlation coefficient r • Computation from the cross product and sums of squared deviations from the mean values: • The correlation coefficient can be computed regardless of variable distribution types. • Associated significance tests depend on the type of distributions and are valid for the bivariate normal distribution. • Coefficient of determination (r2) • Squaring r gives the Coefficient of determination which tells us the proportion of variance that the two variables have in common. For a height-weight example, r = 0.807 and squaring r gives 0.6512, which means that the height of a person explains 65% of the person’s weight; the other 35% could probably be explained by other factors, perhaps nature and nurture. r is dimensionless and can take values from -1 to +1 Statistics & graphics for the laboratory
Correlation Hypothesis testing and r • Testing against zero: • Standard error of r : SEr = [(1-r2)/(N-2)]0.5 t-test for significance against zero: t = (r – 0)/SErwith (N-2) degrees of freedom • Non-zero correlation • r is transformed to z = 0.5 ln[(1+r)/(1-r)] (Fisher´s z-transformation, which yields a symmetric normal-like distribution) • SE of z: [1/(N-3)]0.5 • Hypothesis testing and confidence intervals are based on the z-transformation • Critical values for r • Correlation and P • A weak correlation may be highly statistically significant given a large N, e.g. as observed in large epidemiological studies. • The clinical importance of a given degree of correlation depends on the situation. Statistics & graphics for the laboratory
Correlation Correlation • Meaning of the Pearson correlation coefficient, r • Measure for the strength of linear correlation • Becomes smaller (e.g., <1) when dispersion in y occurs • r is a measure for random analytical error Correlation in method comparison studies • Systematic errors have no influence on r A: No SE B: Constant SE C: Proportional SE D: Constant & proportional SE Statistics & graphics for the laboratory
Correlation Correlation in method comparison studies • The Pearson correlation coefficient, r • Influence of the data range: • r: increases with the range • Inclusion of extreme values: artificial improvement of r • Conclusion: correlation in method comparison studies • The Pearson correlation coefficient, r is, as measure for method comparability, difficult to interpret • r depends on the range of x-values. The greater the range is, the higher are the values for r • r is not influenced by systematic errors • Often, much too small values of r (e.g., r = 0.8) are judged as a good correlation in method comparison Some advocate to use r as indicator for proper data distribution before applying linear regression and recommend for this purpose r-values >0.975 (small range) or >0.99 (wide range). • However, when several methods are compared with the same data-set, r is a useful index for ranking the methods. • Nonparametric correlation • The parametric correlation coefficient is sensitive towards outliers. • Nonparametric correlation coefficients (Spearman or Kendall) are more robust and are calculated on the basis of the ordered (ranked) observations. • The computation principle is an assessment of how well the rank order of the second variable corresponds to the rank order of the first variable. Statistics & graphics for the laboratory
Notes Notes Statistics & graphics for the laboratory
Regression Regression • Linear regression procedures • Linear regression procedures assume a linear relationship between 2 variables (e.g., 2 methods): yi = a0 + b • xi (a0 = intercept; b = slope) • Slope and intercept of the regression line are determined by minimizing the sum of the squared distances between the data points and the regression line (parametric procedures) • Linear regression in method comparison gives information on: • Constant systematic error (intercept) • Proportional systematic error (slope) • Random error (SDy/x) • Non-linear or curvilinear regression procedures • Minimize the sum of squares of the residuals on the basis of any clear mathematical relationship (polynomial, logarithmic, etc.) between two methods • In the easiest case, the curve can be approximated by several linear regression calculations performed over different ranges of x (e.g., the low, middle, and high range) • Curvilinear regression is most adequate for calibration purposes, either for the dose/response case, or for calibration of a routine method through method comparison with a reference method Statistics & graphics for the laboratory
Regression Regression • Linear regression procedures: Overview • Ordinary least-squares regression (OLR) • Weighted variant • Deming regression • Weighted variant • Passing Bablok regression (non-parametric) • Ordinary least-squares regression (OLR) • Assumptions (see also figure): • x: error-free, which implicates that SDax = 0 • y : measurement uncertainty is present, with assumption that SDay is constant throughout the measurement range and normally distributed. Statistics & graphics for the laboratory
Regression Ordinary least-squares regression (OLR) • Computations • OLR: REMARKS • OLR minimizes the sum of the squares of the y-residuals (= deviations of yi from the regression line in y-direction) • The regression line will pass through a centroid point that is the mean of x and the mean of y • Disadvantage of OLR is its sensitivity towards outliers (i.e. extreme values of x or big residuals in the y-direction) • OLR gives biased slope estimate in case of narrow range and measurement error in x • Linear regression estimates: graphical presentation • OLR: Limitation SDay constant • SDay is normally not constant but increases with increasing values of x (when measurement values are distributed over a decade or more). This is reflected in the residual plot by a trend towards increasing scatter at high levels. • >Because of the latter, weighted forms of linear regression have been introduced. • Statistical estimates of OLR • Slope (b), SE(b) & 0.95-confidence limits (CLs) for b • Intercept (a0), SE(a0) & 0.95-CLs for a0 • Standard error of the y-estimate (SDy/x) • Regression residuals • 95% prediction interval for single points Statistics & graphics for the laboratory
Regression Weighted OLR • Weighted linear regression • In a weighted regression procedure, SDa • is regarded proportional to a function • of the level x (=ch(x)) and weights are: • wi = 1/h(xi)2 • Weights are inversely proportional to SDay • Example: • Proportional relationship • between SDa and xi (Fig., upper part): • wi = 1/(xi)2 • Ppossibly truncated at a low limit • (Fig., lower part) • Centroid of a weighted regression line • The centroid point of the • weighted regression line does not pass • through the mean of x and y • but lies more at the side of the origin • Further limitations of OLR • Biased slope estimate in case • of narrow range (x) • and analytical error (a) in x • ß´= ß/(1+λ) • λ = ơa2/ ơX2 • This leads to incorrect • testing of significance • Limitation: error (a) in x • In method comparison studies, the assumption of an error-free x is often not valid. For that reason, regression techniques have been developed that allow error in both variables (x & y): >e.g., Deming regression Statistics & graphics for the laboratory
Regression Deming regression • Assumptions: • x & y: measurement errors may be present in both, with SDax = SDay orSDax and SDay related (SDax/SDay) • SDax and SDay: constant throughout the measurement range and normally distributed • Deming regression estimates a straight line by minimization of the sum of squared distances at an angle to the regression line dependent on the relation between the x and y precision, resulting in an estimate without bias (contrarily to OLR that gives a biased slope estimate in case of SDax0) • Graphical representation of the assumptions: • measurement uncertainty in both x and y • Computation of the Deming regression line • Minimization of the weighted sum of squared • distances to the line: • S = [(x - X)2 + (y-Y)2]; = SDax2/ SDay2 • which provides the solution: • b =[(λq - u)+[(u- λq)2+4 λp2]0.5]/ 2λp • a0 = ym - bxm • Computation of standard errors SE(a0) and SE(b) requires a specialized procedure, e.g. the jackknife method. • Jackknife principle • Computerized resampling principle. Sampling variation is simulated by consecutively withdrawing one (x, y) of the set with recalculation of estimates • From the dispersion of estimates, SEs are derived. The model assumed in Deming regression analysis Statistics & graphics for the laboratory
Model assumed in weighted Deming regression analysis weighted Regression Weighted Deming regression • Higher efficiency in case of proportional measurement uncertainty (constant CV), reflected by more homogenous scatter of standardized residuals and smaller SEs of slope and intercept estimates. • Method comparison example (Datasets-MethComp) • (n = 50; Statistics: CBstat, K. Linnet) • Deming regression: • Slope: b = 1.053 • SE(b) = 0.023; 0.02< P < 0.05 • Intercept:a0 = -0.22 • SE(a0) = 0.19; n.s. from 0 • No significant deviation from linearity • No outliers • Residuals show increased scatter • at high levels: poor model fit. • Weighted Deming regression: • Slope: b = 1.032 • SE(b) = 0.012; 0.01< P < 0.02 • Intercept:a0 = -0.01 • SE(a0) = 0.07; n.s. from 0 • Homogeneous scatter of residuals: • Better model fit. • Weighted versus unweighted Deming • Smaller SEs of slope and intercept: • SE(b) = 0.012 versus 0.023 unweighted • SE(a0) = 0.07 versus 0.19 unweighted Statistics & graphics for the laboratory
Regression Deming regression • Weighted versus unweighted Deming regression • Given measurement values distributed over a decade or more, the analytical SD seldom is constant but varies often proportionally, so that the CV% is about constant. • In this case, it is advantageous to apply a weighted analysis, which provides lower SEs of estimates. • Weighted Deming regression analysis covers the probably most commonly occurring data situation in method comparison studies. • Passing-Bablok regression • Assumptions: • Passing-Bablok regression is a non-parametric method, making no assumptions about distribution of errors. May be used in case of constant or proportional error • It assumes that the ratio SDax/SDay is equal to the slope • Passing-Bablok regression uses the slopes between any two data points xi/yi to calculate the slope of the regression line. The intercept is estimated so that at least half of the data points are located above or on the regression line and at least half the data points below or on the regression line. • An advantage of Passing-Bablok regression is its robustness to outliers. • A disadvantage are the broader confidence intervals (due to the nature of non-parametric procedures). • Geometrical interpretation of regression techniques (minimizing residuals) Statistics & graphics for the laboratory
Regression Linear regression with CBstat – Summary of output data • Slope (b), SE(b) & 0.95-confidence limits (CLs) for b • Intercept (a0), SE(a0) & 0.95-CLs for a0 • Standard error of the y-estimate (SDy/x) • Correlation coefficient (+ P-value) • Outlier identification (4s) • Scatter plot with regression line, 0.95-confidence region and x = y line • Residuals plot (normalized) • Additional: runs test for linearity • Residuals for linearity testing • Relationship correlation & regression • r is related to the regression slope(s): • r = [byxbxy]0.5: r is the geometric mean of the two regression slopes • byx = r SDy/SDx: i.e. r is a rescaled version of the regression slope (identity given SDy = SDx) • r is related to SDy/x: r2~ 1 – SD2y/x/SD2ay • Linear regression – In method comparison • Calculation of a bias (DC) • Bias may consist of: • Constant part (0) • (e.g. fixed matrix effect) • Proportional part (ß-1) • (e.g. calibration difference) • DC = YC – XC = a0 + (b – 1) • XC Runs test: Sequences of residuals with the same sign are counted and related to critical limits (= testing of randomness of residuals) Statistics & graphics for the laboratory
Regression Linear regression – In method comparison • Confidence interval of a bias or Prediction interval • systematic difference (SE) • Statistical significance of estimates: • Does the slope deviate from 1? t = (b-1)/SE(b) • Indication for proportional error • Does the intercept deviate from 0? t = (a0 - 0)/SE(a0) • Indication for constant error • SDy/x (from OLR) • Measure for random error • Are the data pairs linearly related? • Additional in CBstat • Runs test or visual inspection of residuals plot • Indication for (non)linear relationship • Further application • CI for SE at a critical concentration • Statistical test for slope equal to 1 • (95% confidence limits to consider) Simulation: CV 5% Regression y = 0.9443x – 0.1521 95% CLs for slope 0.9106 – 0.9780 Significantly different from 1 Simulation: CV = 15% Regression y = 0.9414x – 0.1233 95% CLs for slope 0.8656 – 1.0172 NOT significantly different from 1: high RE! Statistics & graphics for the laboratory
Regression Interpretation of SDy/x in method comparison • SDy/x is a measure for the random error component in method comparison, i.e. in both x and y. Thus: SDy/x is related to the expected total imprecision: SDy/x2 = SDay2 + b2 SDax2 • Given proportional analytical errors (and intercept around 0), approximately: CVy/x2 = CVay2 + CVax2 or CVy/x = 2 CVay for CVay = CVax • If only imprecision effects play a role in the method comparison, SDy/x2 SDay2 + b2 SDax2 (to convert SDy/x into CVy/x, take value of y) • If SDy/x2>> SDay2 + b2 SDax2 • Proof of sample-related effects(see exercises) • Comparison of regression procedures in practice • Conclusion • Choose the "statistically best" regression method? • Answer: No, look for analytical reasons of the poor comparability! • Notice also that the 95% CLs of the slope are: 1.08 – 1.44 • All regression procedures … • Ordinary least-squares regression (OLR) • Deming regression (DR) • Passing-Bablok regression (PBR) … give nearly thesame results Note: r = 0.993 • The regression procedures … • OLR, DR, PBR … give different results Note: r = 0.871 Statistics & graphics for the laboratory
Regression Regression: Examples from the practice • When different regression procedures give different results … • OLR (red): y = 0.750 x – 0.006 (r = 0.996) • Passing Bablok (blue): y = 0.686 x + 0.022 • … look whether the data are linear! • The residuals plot demonstrates non-linearity • CI for SE at a critical concentration • Therapeutic interval for drug assay: 300 – 2000 nmol/L Delta = Ŷ-X = a0 + (b-1)X = 20.3 +(1.014 – 1)X • X = 300 : Delta = 24.5 ; SE(Delta) = 9.5 Significance test: texp = (Delta – 0)/SE = 2.6 ; tcrit[0.05;n –2) = 1.998 significant • X = 2000: Delta = 48.9 ; SE(Delta) = 34.2 t = 1.4 not significant • Conclusion: • At the lower decision point, a statistical significant difference exists, but it is judged to be clinically unimportant • At the upper decision point, no difference of statistical significance • The assays can be interchanged without clinical consequences Statistics & graphics for the laboratory
Regression Regression & correlation in method comparison • Summary • Perform correlation analysis before [r-values >0.975 (small range) or >0.99 (wide range)] • In case of a method comparison of methods of the same hierarchy, regression techniques, that take the error in x and y into account, should be used. We recommend Deming regression. • Classical OLR is only applicable in case of method comparison with a reference method or in the calibration case (weighed-in concentrations). • Regression data are the more unreliable the greater the random error and the smaller the data range are. • Often forgotten data from regression analysis are the 95% confidence limits of slope and intercept. • Linear regression always results in a line, even when the data are not linear. Therefore, linear regression data always should be accompanied by a graphical presentation of results (scatter plot with x = y line or residuals plot) and the indication of the number of observations. The graph should be visually inspected for adequate range, distribution of data, and linearity • Regression analysis provides information about: • constant systematic difference (intercept) • proportional systematic difference (slope) • random error (SDy/x from OLR) • sample-related effects (SDy/x >>>SDay2 + b2SDax2) • Regression software • CBstat (K. Linnet): A Windows program • (weighted) OLR • (weighted) Deming regression • Passing Bablok regression • (www.cbstat.com) • MedCalc • (www.medcalc.com) • EP-Evaluator (D. G. Rhoads Ass., USA) • (www.dgrhoads.com) • Analyse-It (Excel-plug-in) • (www.analyse-it.com) Statistics & graphics for the laboratory
Regression Regression and calibration • Calculations • Concentration of unknown and its random error • Limit of Detection (LoD) • Graphical model • Concentration (x0) and its random error (Sx0) • NOTE: do not confuse with x at zero (0) concentration! • Calculate x0from signal(y0)via regression equation y = bx + a x0 = (y0 – a)/b • Sx0: approximation: • m = number of measurements of unknown • n = number of calibration points • The confidence interval of x0 is: • CI = ± t(n-2, a) • Sx0 • Calculation of LoD • Yb = "Signal of blank" via regression = intercept a • Sb = "Standard deviation of blank" = Sy/x • "Signal" LoD = a + 3 Sy/x • Calculate CLoD via regression equation. • S = Signal • Yb = Signal of blank • via regression = intercept a • Sb = Sy/x • LoD = a + 3 Sy/x Statistics & graphics for the laboratory
Data transformation CAVE log transformation • Introduction of non-linearity by data transformation in method comparison and commutability studies. • Stöckl D, Thienpont LM. Clin Chem Lab Med 2008;46:1784-5. Statistics & graphics for the laboratory
Exercises CorrRegr-EXCEL • This EXCEL-file describes the advantages and disadvantages of the different EXCEL options for performing correlation and regression analysis. • These options are: • 1. With the fx icon • 2. With Tools>Data Analysis • 3. With a figure • It also contains a worksheet with the additional regression features • -95% confidence interval of the slope • -95% prediction interval • This tutorial contains interactive exercises for self-education in: • -Correlation, and • -Regression • Worksheet correlation shows • the influence of dispersion, slope, intercept, and range on r. • Worksheet regression1 shows • the influence of dispersion, slope, and intercept on the standard errors of slope, intercept, and Sy/x. • Worksheet regression2 shows • the influence of the range on the standard errors of slope, intercept, and Sy/x (this example is constructed with a constant SD over the range). • Note • r and r-square are given for information, only. Correlation&Regression Datasets (Method comparison: Weighted Deming, PractRegr1, PractRegr2) Statistics & graphics for the laboratory
Annex Introduction • EXCEL® requirements • The "Data Analysis" Add-in • In the "Worksheet Menu Bar", under • Tools "Data Analysis" should appear • If it is not present, • Click "Tools" and Add-Ins Activate Analysis ToolPak & Analysis ToolPak - VBA • … if not present in "Add-Ins" • Install them from the EXCEL or Office package • "Add-ins" Statistics & graphics for the laboratory
Annex Tips to create EXCEL®-figures Data&DataPresentation ("Figure") • Create a figure: "Chart-wizard" • Modify a figure with: • "Chart-wizard" • "Chart-menu" • Double-click (left) on an element • Move or size • Left mouse click depressed: Notice the full squares! • Shift & left click: Notice the empty squares! : move with : size with right click > Format object, : or, direct with the "Format" menu Statistics & graphics for the laboratory
Annex Tips to create EXCEL®-figures (ctd.) • Make your own "templates": Activate figure • Chart>Chart type>Custom types>User defined>Add • IMPORTANT: Scale names and sizes are kept too! • Layout tips for EXCEL-figures • Not more than 8 columns (standard width 8,43) • Not more than 22 rows (standard height 12,75) • Font: minimum 16 (14), bold preferred • Use thick lines • Symbol size 6 or 7 • Click off autoscaling • Click "Don't move or size with cells" Statistics & graphics for the laboratory
Annex Copy EXCEL®-figures into PowerPoint • Windows 98 with Office 2000 experience • Copy & paste direct if animation is intended • Copy & paste direct, then >Copy>Delete>Edit>Paste special: Picture (Enhanced metafile: "EMF") = Easy magnification without loss of quality • Copy & paste direct, then >Copy>Delete>Edit>Paste special: GIF, preferably keep 100% size: often looks more attractive • Note: Often preferred to copy the cell-range where the figure is placed ("What you see is what you get": colours, layout) • Adding text: often preferable in PowerPoint! • Print EXCEL®-figures from PowerPoint • Windows 98 with Office 2000 experience • Note: Printing of ppt-Figures may pose problems. • Check the print early if you want to make handouts! • EMF figures ("Cells direct", then EMF) print well • In the absence of Gaussian-type lines • Incorporate text preferably in the .ppt slide and copy both as EMF • [Bigger] GIF figures ("Cells direct", then GIF) • Advantage: better print of Gaussian-type lines • Problems: Incorporated text and scales have poor resolution, can be improved by • Paste direct, then GIF, then add text (& axes, eventually) in ppt, then copy & paste special both as EMF • Note: Overpaste of figure scales with .ppt text fields works only with GIF, but not with EMF. Statistics & graphics for the laboratory
Direct Cells direct Cells direct & EMF Cells direct & GIF Annex Copy EXCEL®-figures into PowerPoint – Examples • Example: 5 columns, 16 rows, font 16 & 14 bold Statistics & graphics for the laboratory


![Data Modeling [Comparison of data modeling techniques ]](https://cdn0.slideserve.com/205866/data-modeling-comparison-of-data-modeling-techniques-dt.jpg)