Download
1 / 26
300 likes | 1.27k Views
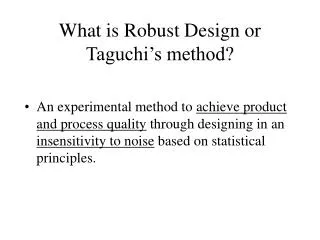
The Taguchi Method:. THE SERVICE MANAGER’S PRIMER TO QUALITY By Ruth Robertson, Boise State University ©2002. GENICHI TAGUCHI. Born in Japan, 1924 Electrical Engineer Worked during 1950’s to improve Japan’s post-WWII telephone communication system

E N D
The Taguchi Method: THE SERVICE MANAGER’S PRIMER TO QUALITY By Ruth Robertson, Boise State University ©2002
GENICHI TAGUCHI • Born in Japan, 1924 • Electrical Engineer • Worked during 1950’s to improve Japan’s post-WWII telephone communication system • Father of the “Taguchi Method” and “Robust Engineering”
Don’t run away! • Not a mathematician? • You can still successfully apply Taguchi Method concepts to your service business. • Basic concepts are simple. • Just keep reading.
Competitive Edge 101: • “In the next century, the capability of developing robust technology will be essential to the competitiveness of any manufacturing enterprise.” (Tsai) (Taguchi: p xi) • Substitute “robust services” and “service enterprise.” You need this.
Competitive Edge 102: • “To compete successfully in the global marketplace, organizations must have the ability to produce a variety of high-quality, low-cost products that fully satisfy customers’ needs.” (Robust Engineering; p. xiii)
Quality Defined • “Any engineered system reaches its ‘ideal function’ when all of its applied energy (input) is transformed efficiently into creating desired output energy.” (Robust p. 6) • Employee energy = input • Customer satisfied = output
Basic Ideas: • CUSTOMER SATISFACTION • Design to the highest standards early in the process to eliminate all non-random errors • Quality Loss = Loss to Society quantified through “Quality Loss Function” • Variation (+/-) from optimal measure results in a loss. • For best results, GET HELP.
Customer Satisfaction • Ways to measure service: 1. Returning customers 2. Number of complaints (1:10) 3. Number of compliments 4. Employee attitude
Design • Equipment – No breakdowns • Specific jobs defined – Need to know responsibilities • Policies and Procedures – What do you want, anyway? • Taguchi Method experiment
Quality Loss Concept • Deviation from target results in loss. • Lower than target • Greater than target • Both lose
Quality Loss Function • Quantify the Loss • Warning: Next slide contains math formulas • But give it a try!
Quality Loss Function II L(y) = k(y-m)2 L(y) = Loss k = constant = cost to correct tolerance2 y = reported value m = mean value (average) (Taguchi On Robust Technology p. 22)
Example: • Company C received an average of 10 complaints per month last year. In November they received 15 complaints (y). Management sets an acceptable level at 2 (tolerance). • It costs the company $50 directly per complaint to correct the problems. They determined the cost in lost sales to be $100. • Total cost per complaint: $150
Example continued: k = $150/22 = $37.50 L(y) = 37.50 (15-10)2 = 37.50 (5)2 = 37.50 (25) = $937.50 is loss for the month of November
Taguchi Experiment – Steps According to Dr. Foster:(OM Review p. 38-44) • Managers’ job: • Identify the Problems • Brainstorm • Contribute to experiment design • Facilitator’s job: • Design experiment • Run experiment • Analyze results • Confirm experiment
Step 1: Problem Identification • What do managers and/or employees see that need improvement?
Step 2:Brainstorming • Identify critical variables in the service that affect quality. • Open and honest discourse with all people involved. • Decide which factors are controllable and which are not.
Step 3: Experiment Design • Using results from brainstorming session, facilitator will design an experiment. • Management must understand this part, and needs to fully support the resources needed for it.
Step 4:Experiment • Use of ANOVA requires managers understand its use. • Facilitator, although in charge of the experiment, must assure management’s understanding of the process.
Step 5:Analysis • Factors closest to target specification identified. • Means to reduce controllable variation produced.
Step 6:Confirm Experiment • Set up new system using data from experiment. • Test and validate results.
Conclusion: • Best improvement is early in the process. • Use expert consulting help for full experiment and implementation. • Successfully used in airlines, insurance, hotels and restaurants. • Quality is a major feature that sets a service apart from the rest.
Citations: • Foster, S. Thomas Jr. Ph. D.: “Designing and Initiating A Taguchi Experiment in a Services Setting” OM Review – Refereed: Volume 9, No. 3. • Taguchi, Genichi: Taguchi on Robust Technology Development: Bringing Quality Engineering Upstream; Asme Press, New York, 1993 • Taguchi, Chowdhury, Taguchi: Robust Engineering: Learn how to boost quality while reducing costs and time to market; McGraw-Hill, New York, 2000
Recommended Reading: • In addition to cited works: • Visit American Supply Institute (ASI) website at www.amsup.com