Download
1 / 101
1.01k likes | 1.2k Views
Survey took place in Summer (July and early August) and Autumn (late September to mid ... Base: All respondents in Summer and Autumn surveys combined expressing an opinion (min: ...

E N D
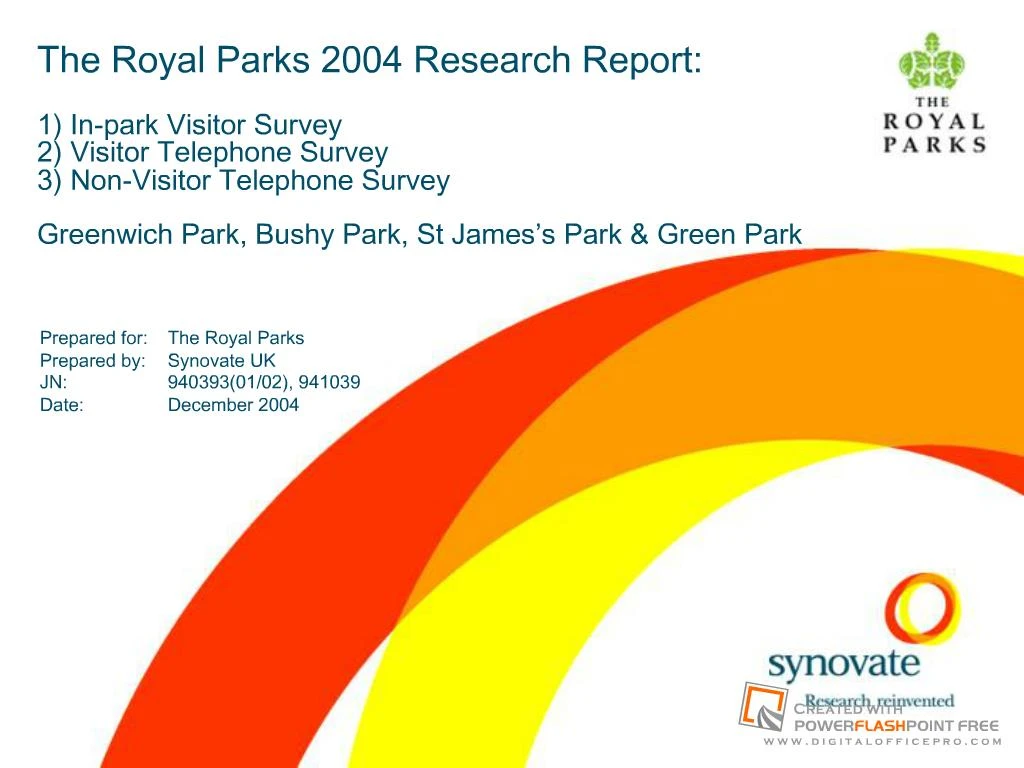
1. The Royal Parks 2004 Research Report:
2. Structure of Report Background & Business Objectives
Research Objectives
Methodology
Summary of Findings
Conclusions & Recommendations
Research Findings
In-park Visitor Survey
Visitor Telephone Survey
Non-visitor Telephone Survey
3. Background & Business Objectives
The Royal Parks wished to put in place a significantly enhanced Visitor Research Programme, starting in 2004, to contribute towards achieving its 2003/4 � 2005/6 Business Objectives, as well as guiding future strategies and Park programmes.
The Business Objectives can be summarised as follows:
To improve the quality and range of visitor services
To protect, conserve and enhance the environment of the Parks
To develop policies and initiatives to encourage wider use of the Parks
To raise the profile, understanding & value of the Parks
To manage the Parks efficiently and effectively
4. Research Objectives There are a number of objectives, divided into three tiers of importance:
5. Methodology
6. Overview Of Programme At this stage, The Royal Parks believe it is likely that in 2006 research will be conducted to evaluate the KPIs in all eight Parks, as well as conducting some highly targeted additional research.At this stage, The Royal Parks believe it is likely that in 2006 research will be conducted to evaluate the KPIs in all eight Parks, as well as conducting some highly targeted additional research.
7. How Research Parts Address Objectives
8. In-Park Visitor Survey Visitors were interviewed as they left the Parks.
4 Parks were surveyed in 2004, 4 in 2005.
Survey took place in Summer (July and early August) and Autumn (late September to mid October).
�Next available respondent� recruitment technique used.
Survey was paper-based, with interviewer reading out questions.
Interview lasted about 10 minutes.
Interviews took place at various times on weekdays, and weekends.
Interviewers rotated around different Park exits.
In 2004 and 2005, c.200 interviews were conducted in each of the 4 Parks in Summer, and c.140 at each in Autumn.
9. Telephone Visitor and Non-Visitor Survey Respondents interviewed on the telephone in their homes.
4 Parks surveyed in 2004, 4 in 2005.
Survey took place in October.
Interviewing took place in areas within an agreed defined radius for each of the parks.
Interviews took place in evenings and weekends to ensure no bias to non-workers.
150 interviews amongst non-users per park (who have not visited in the last 12 months).
100 interviews amongst users per park (who have visited in the last 12 months).
Non-users interview lasts 12 mins; users: 6 mins.
10. Summary of Findings
11. Summary of Findings (1 of 9) OVERALL RATING OF PARKS
All four Parks are rated very highly on the overall rating, with over 90% of visitors in the In-Park Survey rating each one as either �excellent� or �good�.
Greenwich and St James�s are rated highest, and Bushy and Green significantly lower in terms of the �excellent� rating.
Amongst those interviewed in the Visitor�s Telephone Survey, all four Parks except Green are rated very highly (on enjoyment). Greenwich and Bushy are rated highest.
RATING OF PARKS COMPARED TO OTHER PLACES OF INTEREST
Amongst those interviewed in the Telephone Survey, all four Parks except Green are rated as more enjoyable than The Tate Modern, The Tower of London, Madame Taussaud�s and Hyde Park.
Greenwich, Bushy and St James�s are also rated equally enjoyable to The Natural History Museum, but less enjoyable than Kew Gardens.
KPI PERFORMANCE RATINGS (IN-PARK VISITOR SURVEY)
Park Environment (Tidiness & Cleanliness, Upkeep and Peace & Quiet): All four Parks score highly and highest on these aspects. Greenwich scores particularly highly on �Tidiness & Cleanliness�, and (along with Bushy) on �Upkeep� and Greenwich and St James�s score especially highly on �Peace & Quiet�.
A high 13% spontaneously mention they would like Bushy Park to have more dog litter bins/for dog mess to be cleared up.
12. Summary of Findings (2 of 9) KPI PERFORMANCE RATINGS (IN-PARK VISITOR SURVEY) CONT�D
Ease of Getting Around & Access: All four Parks are rated highly (and equally) on these areas.
Information (Signposting & Maps, Information on Park Features): Greenwich and St James�s score relatively highly on Signposting and Information. Bushy and Green Park achieve only fair scores for these.
Visibility & Friendliness of Park Staff: Greenwich and St James�s received fair scores for these, but the scores for Bushy and Green are fair to poor.
The fact that �visibility and friendliness of staff� is rated lower at Bushy Park may be related to lower proportions of visitors rating the Park as �very safe�, compared to the other three Parks.
Catering (Number of Facilities, Quality of Facilities): Greenwich scores relatively highly on �number� and �quality�. St James�s, Bushy and Green all received fair to poor ratings for �number� and �quality�.
With respect to Bushy Park, a high 13% spontaneously mentioned that they would like more/better catering facilities.
Toilets (Number of Toilets and Quality of Toilets): The �number of toilets� is rated as fair in Greenwich and St James�s, but as poor in Green and especially Bushy Park.
With respect to Bushy Park, a high 18% spontaneously mentioned that they would like more/better/cleaner toilets.
13. Summary of Findings (3 of 9) KPI PERFORMANCE RATINGS (IN-PARK VISITOR SURVEY) CONT�D
Facilities for Children: Greenwich and Bushy Park score well in this respect, but St James�s and Green are rated as fair.
Facilities for Adults: All four parks score well on this area.
Sports Facilities (Number and Quality): Greenwich receives good scores on these areas, Bushy receives fair scores, and St James�s and Green receive poor scores.
Seating: Greenwich scores highly on this aspect, while the scores for Bushy, St James�s and Green are satisfactory to good.
With respect to Green Park, a high 11% spontaneously suggested �more seating� as an improvement.
The rating is significantly lower in Autumn in Green Park (after the deckchair service ends).
KPI IMPORTANCE RATINGS (IN-PARK VISITOR SURVEY)
Park Environment (Tidiness & Cleanliness, Upkeep and Peace & Quiet): �Tidiness and cleanliness� and �upkeep of the park� are rated as highly important and the most important areas in all 4 Parks.
�Peace and quiet� is slightly less important in the central parks St James�s and Green.
Ease of Getting Around & Access: These aspects are equally rated as very important for all Parks.
14. Summary of Findings (4 of 9) KPI IMPORTANCE RATINGS (IN-PARK VISITOR SURVEY) CONT�D
Toilets (Number of Toilets and Quality of Toilets): The �quality of toilets� is rated as highly important in all four Parks.
The �number of toilets� is rated as highly important in Greenwich, and slightly less so in Bushy, St James�s and Green.
Visibility & Friendliness of Park Staff: This aspect is rated as very important for Greenwich, and fairly important for Bushy, St James�s and Green.
Information (Signposting & Maps, Information on Park Features): �Information on Features� is rated very important for Greenwich and important for Bushy, St James�s and Green.
�Signposting and Maps� is considered slightly less important than �Information on Features�.
Seating: This is seen as highly important in Greenwich, St James�s and Green, and slightly less so in Bushy.
Catering (Number of Facilities, Quality of Facilities): The �quality� is seen as more important than the �number� across all four Parks. The quality is very important at Greenwich and quite important for Bushy, St James�s and Green.
Facilities for Children: These are important at Greenwich and Bushy, but less important for St James�s and Green.
Facilities for Adults: This aspect is quite important for Greenwich, but not very important for Bushy, St James�s and Green.
Sports Facilities (Number and Quality): These are quite important for Greenwich , but not very important for Bushy, St James�s and Green.
15. Summary of Findings (5 of 9) AWARENESS OF WHAT THERE IS TO DO IN THE PARKS AMONG NON-VISITORS (TELEPHONE SURVEY)
Awareness (unprompted) of what there is to do among Non-Visitors is not very high.
Being aware of what the Parks have to offer is the main factor that could motivate people to visit them (when prompted by a list): between 39% and 50% mention this for each of the Parks.
Greenwich: 41% could not recall anything about the Park and only 22% mention �historical buildings� and an 13% the observatory. None mentioned any of the sports on offer.
Bushy: 47% could not recall anything about it. The children�s playground was the highest mention (25%).
St James�s: 59% could not recall anything about it. Only catering facilities was mentioned by more than 10% (18%).
Green: 70% could not recall anything about it. It is recalled mainly for its footpaths (8%).
KEY SUGGESTIONS FROM RESPONDENTS FOR IMPROVING THE PARKS
Parking at Greenwich: this was spontaneously mentioned by 10% in the In-Park Survey. 25% also named this as a reason for not visiting Greenwich (when prompted in the Non-Visitors Telephone Survey).
When prompted with a list, a high proportion of visitors would like to see Events or Activities in each of the four Parks (between 6 and 9 out of 10), especially at Greenwich (91%), less so at St James�s (60%) (in the In-Park Survey).
16. Summary of Findings (6 of 9) KEY SUGGESTIONS FROM RESPONDENTS FOR IMPROVING THE PARKS CONT�D
Consistent with the KPI ratings, more/better/cleaner toilets at Bushy are spontaneously mentioned by a high 18% (in the In-park Survey).
More seating at Bushy is spontaneously mentioned by 11% (in the In-Park Survey).
Improved Catering Facilities at Bushy are spontaneously mentioned by 8% (in the Visitors Telephone Survey).
Improved Safety. Whilst only a very small proportion rate the Parks as unsafe, a significant proportion (around 30%) rate the Parks as �quite safe�, as opposed to �very safe� (in the Visitors Telephone Survey). Bushy is rated less safe than the other three. In the Non-Visitors Telephone Survey, a high 13% state they would not feel safe at Bushy.
EVENTS AND ACTIVITIES CURRENT VISITORS WOULD LIKE TO SEE (IN-PARK SURVEY)
A significant proportion of visitors at St James�s Park (40%) and at Green Park (24%), do not want to see any events or activities in the Park.
Music Events and Concerts are the most requested events overall, wanted by a high 48% of those interviewed at Greenwich and about 35% of those at Bushy and Green (36% and 35% respectively), but only 18% at St James�s.
(Open-air) Theatre Events are wanted by a high 41% for Greenwich, 31% for Bushy and 22% for Green (and only 11% for St James�s).
Wildlife Events are requested by a high 45% of those interviewed at Bushy (the most requested event for this Park) and 31% at Greenwich.
Children�s Events, Historical Events and Guided Walks/Talks are requested by around 25% of those in the Greenwich and Bushy surveys.
17. Summary of Findings (7 of 9) HOW NON-VISITORS COULD BE ENCOURAGED TO VISIT PARKS
Around 75% of those interviewed spontaneously named at least one reason that could motivate them to visit the Parks. Moreover, between a 32% (Green) and 52% (Bushy) say they are extremely or fairly likely to visit the Park in the next year.
Events and Activities are the most frequently mentioned reason (spontaneously) overall that could motivate people to visit the Parks, named by between 9% (Bushy) and 19% (Green) of non-visitors. The highest specific (spontaneous) Events and Activities mentioned are:
Bushy and Green: Catering Facilities (around 10%)
Greenwich: Activities for Children (13%)
Green, Greenwich and St James�s: Music events/concerts (around 8%)
When prompted with a list of ways of encouraging people to visit the Parks, many reasons receive high mentions:
As previously mentioned, Knowing what there is to do in the Parks is the main mention (by between 39% and 50%) that could motivate people to visit the Parks.
Parking is named as a key issue by between a 31% and 42%.
If it were easier to get to/not so far is named by between 23% and 43% for each of the Parks.
Improved toilets is mentioned by between 23% and 39% for each of the Parks.
If I felt safe there is mentioned by between 19% and 26% (highest for Bushy).
18. Summary of Findings (8 of 9) EXTENT TO WHICH ROYAL PARKS IMPROVE QUALITY OF LIFE
Both visitors and non-visitors agree strongly overall that the Parks improve the quality of life in their areas and in London as a whole. Only between 5% (Bushy and Green) and 11% (Greenwich) of Non-visitors disagree.
DECISION TO VISIT PARKS
When Decide to Visit Parks: Visits to the Parks are largely made on the day of the visit (by around 75%).
The weather is an important factor for visits, especially for current non-visitors. It is less important for Greenwich and Bushy.
Main reasons for visiting Parks:
For fresh air, a walk and peace and quiet are the main reasons (in the In-park survey) for visiting the Parks, named by between 22% and 48% for the Parks.
Going with friends/family is mentioned by around 20% at both Greenwich and St James�s (in the Visitor Telephone Survey).
Bushy: To bring the children, walk the dog and exercise are key reasons, named by about between 21% and 33% (in the In-park Survey).
St James�s and Green: As part of sightseeing, on way to visitor attraction are named by between 10% and 20%.
Green and St James�s: As a shortcut is named by 37% for Green and 20% for St James�s.
St James�s: To see the wildlife is named by 17%.
19. Summary of Findings (9 of 9) TIME AND LENGTH OF VISITS
Seasons Parks are Visited: Around 50% of visitors interviewed (in Visitor Telephone Survey) claim to visit the Parks all year round and between 31% (Bushy) and 51% (St James�s) visit in Summer.
Days, Times and Length of Visits
Days: Bushy and Greenwich attract more visitors at weekends,while visits to St James�s and Green are more evenly spread across weekends and weekdays.
Times: Most visits are made between 1pm and 6pm.
Length of Visits: Stays are generally longer in Summer than Autumn. Visits to Green and St James�s are around 40 minutes to an hour. Visits to Greenwich and Bushy are around an hour and a half.
PROFILE OF VISITORS AND NON-VISITORS
Non-visitors of Bushy tend to be from a household with no children, which is consistent with the importance of visitors taking children there (especially for children�s playground).
20. Conclusions & Recommendations
21. Conclusions and Recommendations (1 of 3) PARK-WIDE PRIORITY AREAS
Park Environment (Tidiness & Cleanliness, Upkeep and Peace & Quiet) is of paramount importance, and therefore it is important that the emphasis on these aspects is continued in order to maintain the high satisfaction scores.
Toilets: Firstly, providing more toilets and improving condition of toilets is the highest priority for all four Parks. At Bushy and Greenwich, where length of visit is longest of all four Parks, this aspect emerges as particularly important.
Higher Quality Catering Facilities are, after toilets, the next highest priority in all four Parks, but particularly so in Bushy and, to a lesser extent at St James�s. An increase in the standard of catering facilities (and advertising them) would probably increase use and therefore represent an opportunity/need to provide more facilities/ greater capacity.
Increase Awareness of What There is to do in Parks: Given the low awareness of what the Parks have to offer amongst local (and presumably more distant) non-visitors, it seems clear that advertising the Park offerings could encourage current non-visitors, and frequency of visits.
For Greenwich, the observatory and sports facilities could be advertised given low recall of these features;
For Bushy, its �wildness� and �wildlife� features/events. Advertising any increase in safety in campaign would also be beneficial;
For St James�s, advertising its proximity to key London attractions (Buckingham Palace), �Inn the Park� and the wildlife;
For Green, again the proximity to attractions, and �peace & quiet� from a West End shopping trip, for example.
22. Conclusions and Recommendations (2 of 3) PARK-WIDE PRIORITY AREAS CONT�D
Other Advertising Ideas:
Exploiting the �Royal� status of the Parks could be particularly attractive to overseas visitors;
Given the very positive perception of the role of The Parks, advertising as �the lungs of London and for being tranquil/oases could be motivating.;
The enjoyment of a fun, relaxed day outside with friends/ family;
Offering and Advertising (More) Activities and Events could stimulate non-visitors to visit and greater frequency of visiting.
Music events, concerts and theatre, particularly in Greenwich, Bushy and Green;
Wildlife events at Bushy and Greenwich;
Children's events, historical events and guided walks & talks at Greenwich and Bushy;
Community focussed events at the provincial Parks, such as firework displays and Easter Egg hunts;
Health benefits of walking.
Increased Seating is an aspect that may result in higher visit satisfaction at all Parks, with the exception of Greenwich.
23. Conclusions and Recommendations (3 of 3) PARK-WIDE PRIORITY AREAS CONT�D
Information on Park Features: These are priorities for improvement for Green and Greenwich, in particular. But we suggest improving these in all Parks to stimulate greater interest and repeat visits. We believe that providing information in key foreign languages (in the Central Parks) would also be important, as would a focus on the key places of interest within the vicinity of Parks.
Improving Safety, especially at Bushy, and advertising this could attract more visitors. Increasing the visibility of staff would probably be the best way of addressing this issue. CCTV could be another option.
PARK-SPECIFIC PRIORITY AREAS
Greenwich: Increasing Parking capacity, and developing different tiers of tariffs depending on day of week/ season.
Bushy Park: more dog litter bins and cleaning-up of dog mess on paths.
St James�s and Green: Shops/Merchandising. Given the high proportion of overseas visitors to these Parks, and the importance of the Royal Parks to life in/ a visit to London, there is potential for a shop selling Royal Parks merchandise. Information on Park features and associations would help to stimulate interest. We would suggest conducting further research on this aspect.
24. In-park Visitor Survey
25. Overall Rating of Parks
26. Overall Rating � Summer & Autumn Combined The chart above shows overall satisfaction levels across the four Parks from data collected in the Summer and Autumn waves and is based on visitors expressing an opinion.
As is clearly evident, overall satisfaction levels at all four Parks is very high with over 90% of visitors expressing an opinion rating each Park as either �excellent� or �good�. Overall satisfaction scores at both Greenwich Park and St James�s Park are highest with two thirds of visitors respectively giving an �excellent� rating, compared to around half at both Bushy Park and Green Park respectively.
Visitors interviewed at St James�s Park in Autumn give higher overall satisfaction scores, compared to visitors interviewed in Summer (99% rate the Park as either �excellent or �good� in Autumn, compared to 89% in Summer). It should be noted that many Key Performance Indicator�s rated by visitors at St James�s Park in Autumn have seen an increase in satisfaction levels.
There are no reportable differences in overall satisfaction levels in terms of visitor profile or activities undertaken at any of the four Parks.The chart above shows overall satisfaction levels across the four Parks from data collected in the Summer and Autumn waves and is based on visitors expressing an opinion.
As is clearly evident, overall satisfaction levels at all four Parks is very high with over 90% of visitors expressing an opinion rating each Park as either �excellent� or �good�. Overall satisfaction scores at both Greenwich Park and St James�s Park are highest with two thirds of visitors respectively giving an �excellent� rating, compared to around half at both Bushy Park and Green Park respectively.
Visitors interviewed at St James�s Park in Autumn give higher overall satisfaction scores, compared to visitors interviewed in Summer (99% rate the Park as either �excellent or �good� in Autumn, compared to 89% in Summer). It should be noted that many Key Performance Indicator�s rated by visitors at St James�s Park in Autumn have seen an increase in satisfaction levels.
There are no reportable differences in overall satisfaction levels in terms of visitor profile or activities undertaken at any of the four Parks.
27. KPI Performance Ratings Visitors were asked to state how satisfied they were with the individual aspects of the Park (the KPI�s) using a scale of �excellent�, �good�, �satisfactory�, �poor� and �very poor�.
The first two charts show the mean score ratings (out of 5) for each of the four Parks. The following eight charts show the distribution of the ratings for each of the four Parks. Please note that figures are based on all visitors expressing an opinion.Visitors were asked to state how satisfied they were with the individual aspects of the Park (the KPI�s) using a scale of �excellent�, �good�, �satisfactory�, �poor� and �very poor�.
The first two charts show the mean score ratings (out of 5) for each of the four Parks. The following eight charts show the distribution of the ratings for each of the four Parks. Please note that figures are based on all visitors expressing an opinion.
28. Comparison of Parks on KPI Performance Ratings (1 of 2) The chart above shows the mean score satisfaction ratings (out of 5) for all four Parks in respect of aspects relating to park environment, information and staff and catering, and is based on data aggregated from both the Summer and Autumn interviewing waves.
All four Parks score highly on aspects relating to the park environment, but generally tend to achieve lower scores in respect of aspects relating to both information and staff and catering. The exception is Greenwich Park which receives higher scores for the �number� and �quality� of catering facilities, compared to the other three Parks. Both the �visibility and friendliness of staff� and the �information on Park features� at Bushy Park and Green Park achieve lower scores than the other two Parks. That �visibility and friendliness of staff� is rated lower at Bushy Park may be correlated to lower proportions of visitors rating the Park as �very safe�, compared to the other three Parks.
Cont/d�The chart above shows the mean score satisfaction ratings (out of 5) for all four Parks in respect of aspects relating to park environment, information and staff and catering, and is based on data aggregated from both the Summer and Autumn interviewing waves.
All four Parks score highly on aspects relating to the park environment, but generally tend to achieve lower scores in respect of aspects relating to both information and staff and catering. The exception is Greenwich Park which receives higher scores for the �number� and �quality� of catering facilities, compared to the other three Parks. Both the �visibility and friendliness of staff� and the �information on Park features� at Bushy Park and Green Park achieve lower scores than the other two Parks. That �visibility and friendliness of staff� is rated lower at Bushy Park may be correlated to lower proportions of visitors rating the Park as �very safe�, compared to the other three Parks.
Cont/d�
29. KPI Ratings � Summer and Autumn Combined (1 of 2) �Cont/d
Whilst Bushy Park achieves relatively high ratings for the park environment (and especially �peace and quiet�), it performs less well on both aspects relating to catering. Indeed, when asked what improvements visitors to Bushy Park would like to see, of those expressing an opinion, a fifth (20%) mentioned �improved catering facilities�. Information on park features would also seem to be a possible area for improvement at both Bushy Park and Green Park, where ratings for this aspect are lower than at Greenwich Park and St James�s Park.
St James�s Park achieves generally higher satisfaction scores in Autumn, compared to Summer, which is consistent with the Park�s higher levels of overall satisfaction in Autumn. Meanwhile, the other three Parks generally maintain similar scores in Autumn, compared to Summer, with some notable exceptions. Satisfaction with �visibility and friendliness of staff� is lower at both Green Park and Bushy Park in Summer, compared to Autumn. At Green Park all aspects of �toilets and �other facilities� are rated lower in Summer, compared to Autumn.�Cont/d
Whilst Bushy Park achieves relatively high ratings for the park environment (and especially �peace and quiet�), it performs less well on both aspects relating to catering. Indeed, when asked what improvements visitors to Bushy Park would like to see, of those expressing an opinion, a fifth (20%) mentioned �improved catering facilities�. Information on park features would also seem to be a possible area for improvement at both Bushy Park and Green Park, where ratings for this aspect are lower than at Greenwich Park and St James�s Park.
St James�s Park achieves generally higher satisfaction scores in Autumn, compared to Summer, which is consistent with the Park�s higher levels of overall satisfaction in Autumn. Meanwhile, the other three Parks generally maintain similar scores in Autumn, compared to Summer, with some notable exceptions. Satisfaction with �visibility and friendliness of staff� is lower at both Green Park and Bushy Park in Summer, compared to Autumn. At Green Park all aspects of �toilets and �other facilities� are rated lower in Summer, compared to Autumn.
30. Comparison of Parks on KPI Performance Ratings (2 of 2) The chart above shows the mean score satisfaction ratings (out of 5) for all four Parks in respect of aspects relating to toilets, other facilities and ease of getting around.
The �number of toilets� is rated relatively poorly at all four Parks, with Bushy Park receiving the lowest score in this respect. Indeed, elsewhere in the questionnaire when asked what improvements visitors to Bushy Park would like to see, a fifth (18%) mentioned �more/better/cleaner toilets�. Greenwich Park achieves consistently higher scores on all aspects of toilets and other facilities, and particularly for �sports facilities�.
Meanwhile, at the two Central Parks � Green Park and St James�s Park � sports facilities receive lower satisfaction ratings which is perhaps unsurprising given that neither Park offers any. With the exception of Greenwich Park, all three other Parks gain lower scores in respect of �seating�, which suggests a possible area for consideration, not least at Green Park where 11% suggested �more seating� as an improvement.
All four Parks are rated relatively highly (and equally) for both aspects relating to ease of getting around suggesting that there are no particular problems that require attention.The chart above shows the mean score satisfaction ratings (out of 5) for all four Parks in respect of aspects relating to toilets, other facilities and ease of getting around.
The �number of toilets� is rated relatively poorly at all four Parks, with Bushy Park receiving the lowest score in this respect. Indeed, elsewhere in the questionnaire when asked what improvements visitors to Bushy Park would like to see, a fifth (18%) mentioned �more/better/cleaner toilets�. Greenwich Park achieves consistently higher scores on all aspects of toilets and other facilities, and particularly for �sports facilities�.
Meanwhile, at the two Central Parks � Green Park and St James�s Park � sports facilities receive lower satisfaction ratings which is perhaps unsurprising given that neither Park offers any. With the exception of Greenwich Park, all three other Parks gain lower scores in respect of �seating�, which suggests a possible area for consideration, not least at Green Park where 11% suggested �more seating� as an improvement.
All four Parks are rated relatively highly (and equally) for both aspects relating to ease of getting around suggesting that there are no particular problems that require attention.
31. KPI Performance Ratings: Greenwich Park (1 of 2) The above chart shows satisfaction ratings given by visitors in respect of the various aspects of Greenwich Park (the top rated aspects based on �excellent� scores are shown here with the lower rated aspects shown on the following chart).
It is clear that the two most highly rated aspects relate to the Park environment; �upkeep of the Park� and �tidiness and cleanliness�, with around half of visitors interviewed and expressing an opinion giving an �excellent� rating for each aspect, and a further two fifths giving a �good� rating respectively. The Park also performs well in respect to �peace and quiet�, with around four fifths rating this aspect as either �excellent� or �very good�. Both aspects relating to the Park�s accessibility receive the next highest �excellent� ratings. Moderate dissatisfaction begins to become evident in respect of �children�s facilities and �information on the Park�s features�, with around a tenth of visitors expressing an opinion giving each one a rating of either �poor� or �very poor�.
Satisfaction with �peace & quiet� is higher in Autumn (93% rating it as either �excellent� or �good�, compared with 77% in Summer), as is �seating� (91% vs 83%), �ease of getting around� (93% vs 84%), �information on park features� (81% vs 60%) and �ease of access by chosen method of transport� (92% vs 82%).The above chart shows satisfaction ratings given by visitors in respect of the various aspects of Greenwich Park (the top rated aspects based on �excellent� scores are shown here with the lower rated aspects shown on the following chart).
It is clear that the two most highly rated aspects relate to the Park environment; �upkeep of the Park� and �tidiness and cleanliness�, with around half of visitors interviewed and expressing an opinion giving an �excellent� rating for each aspect, and a further two fifths giving a �good� rating respectively. The Park also performs well in respect to �peace and quiet�, with around four fifths rating this aspect as either �excellent� or �very good�. Both aspects relating to the Park�s accessibility receive the next highest �excellent� ratings. Moderate dissatisfaction begins to become evident in respect of �children�s facilities and �information on the Park�s features�, with around a tenth of visitors expressing an opinion giving each one a rating of either �poor� or �very poor�.
Satisfaction with �peace & quiet� is higher in Autumn (93% rating it as either �excellent� or �good�, compared with 77% in Summer), as is �seating� (91% vs 83%), �ease of getting around� (93% vs 84%), �information on park features� (81% vs 60%) and �ease of access by chosen method of transport� (92% vs 82%).
32. KPI Performance Ratings: Greenwich Park (2 of 2) The above chart shows satisfaction ratings of various aspects of Greenwich Park (the bottom rated aspects based on �excellent� scores are shown here with the higher rated aspects shown on the previous chart).
As the chart shows, the four lowest rated aspects relate to �sports facilities� and �toilets� with only around a tenth of visitors expressing an opinion respectively giving an �excellent� rating for each. In respect of the �number of toilets�, a fifth of visitors expressing an opinion rate them as �poor�.
There are very few reportable seasonal differences at Greenwich Park, the exception being in respect to satisfaction with the �number of catering facilities� which is higher in Autumn (76% rating it as either �excellent� or �good�), compared with Summer (64%). The above chart shows satisfaction ratings of various aspects of Greenwich Park (the bottom rated aspects based on �excellent� scores are shown here with the higher rated aspects shown on the previous chart).
As the chart shows, the four lowest rated aspects relate to �sports facilities� and �toilets� with only around a tenth of visitors expressing an opinion respectively giving an �excellent� rating for each. In respect of the �number of toilets�, a fifth of visitors expressing an opinion rate them as �poor�.
There are very few reportable seasonal differences at Greenwich Park, the exception being in respect to satisfaction with the �number of catering facilities� which is higher in Autumn (76% rating it as either �excellent� or �good�), compared with Summer (64%).
33. KPI Performance Ratings: Bushy Park (1 of 2) The above chart shows satisfaction ratings given by visitors in respect of the various aspects of Bushy Park (the top rated aspects based on �excellent� scores are shown here with the lower rated aspects shown on the following chart).
Again, it is clear that aspects relating to the Park environment score particularly highly, with around two fifths of visitors expressing an opinion respectively rating �peace and quiet� and �upkeep of the Park� as �excellent�. Visitors to Bushy Park ordinarily arrive by car and thus it is encouraging to see that satisfaction scores in respect of �ease of access by chosen method of transport� is also very high.
As mentioned previously, there are robust signs of dissatisfaction in regard to the �visibility and friendliness of staff�, with over two fifths (43%) of those expressing an opinion rating this aspect as either �poor� or �very poor�. The problem seems to be more acute amongst those bringing children to the Park, given that 57% of these visitors rate this aspect negatively.
As alluded to earlier, there might also be some correlation between this aspect and feelings concerning safety in the Park, although no definite conclusions can be made given the size of the sample concerned.
Satisfaction with �peace and quiet� is higher in Summer (87% rating it as �excellent� or �good� vs 79% in Autumn), whilst �visibility and friendliness of Park staff� is rated higher in Autumn (43%), compared to Summer (24%)
The above chart shows satisfaction ratings given by visitors in respect of the various aspects of Bushy Park (the top rated aspects based on �excellent� scores are shown here with the lower rated aspects shown on the following chart).
Again, it is clear that aspects relating to the Park environment score particularly highly, with around two fifths of visitors expressing an opinion respectively rating �peace and quiet� and �upkeep of the Park� as �excellent�. Visitors to Bushy Park ordinarily arrive by car and thus it is encouraging to see that satisfaction scores in respect of �ease of access by chosen method of transport� is also very high.
As mentioned previously, there are robust signs of dissatisfaction in regard to the �visibility and friendliness of staff�, with over two fifths (43%) of those expressing an opinion rating this aspect as either �poor� or �very poor�. The problem seems to be more acute amongst those bringing children to the Park, given that 57% of these visitors rate this aspect negatively.
As alluded to earlier, there might also be some correlation between this aspect and feelings concerning safety in the Park, although no definite conclusions can be made given the size of the sample concerned.
Satisfaction with �peace and quiet� is higher in Summer (87% rating it as �excellent� or �good� vs 79% in Autumn), whilst �visibility and friendliness of Park staff� is rated higher in Autumn (43%), compared to Summer (24%)
34. KPI Performance Ratings: Bushy Park (2 of 2) The above chart shows satisfaction ratings of various aspects of Bushy Park (the bottom rated aspects based on �excellent� scores are shown here with the higher rated aspects shown on the previous chart).
Aspects relating to both �toilets� and catering receive the lowest satisfaction scores amongst visitors expressing an opinion. Whilst just 8% of visitors rate �number of toilets� as �good� (no one rates them as �excellent), a fifth (19%) of visitors rate them as �very poor� and 52% as �poor�.
Both the �number� and �quality� of the catering facilities achieve relatively low satisfaction ratings, with the �number of catering facilities� rated either �poor� or �very poor� by two fifths of those visitors expressing an opinion. As has been mentioned previously, when asked what improvements would result in increased enjoyment of the Park, visitors rate �toilets� and �catering facilities� as the top two suggestions.
Satisfaction with �information on park features� is higher in Autumn (43% rating either �excellent� or �good� vs 31% in Summer), as is �number of sports facilities� (52% vs 30%).
The above chart shows satisfaction ratings of various aspects of Bushy Park (the bottom rated aspects based on �excellent� scores are shown here with the higher rated aspects shown on the previous chart).
Aspects relating to both �toilets� and catering receive the lowest satisfaction scores amongst visitors expressing an opinion. Whilst just 8% of visitors rate �number of toilets� as �good� (no one rates them as �excellent), a fifth (19%) of visitors rate them as �very poor� and 52% as �poor�.
Both the �number� and �quality� of the catering facilities achieve relatively low satisfaction ratings, with the �number of catering facilities� rated either �poor� or �very poor� by two fifths of those visitors expressing an opinion. As has been mentioned previously, when asked what improvements would result in increased enjoyment of the Park, visitors rate �toilets� and �catering facilities� as the top two suggestions.
Satisfaction with �information on park features� is higher in Autumn (43% rating either �excellent� or �good� vs 31% in Summer), as is �number of sports facilities� (52% vs 30%).
35. KPI Performance Ratings: St James�s Park (1 of 2) The above chart shows satisfaction ratings given by visitors in respect of the various aspects of St James�s Park (the top rated aspects based on �excellent� scores are shown here with the lower rated aspects shown on the following chart).
As with other Parks, St James�s receives high levels of satisfaction for aspects relating to the Park environment, most notably �upkeep of the park� followed by �tidiness and cleanliness�, but lower ratings for �peace and quiet�. Both aspects relating to accessibility to and within the Park also receive relatively high satisfaction scores, with around a third of visitors expressing an opinion respectively rating each of them as �excellent�. Whilst a fifth (18%) of visitors expressing an opinion rate �seating� as �excellent�, a further fifth (13%) rate is as either �poor� or �very poor�.
Most aspects in the chart above are rated more highly by visitors interviewed in Autumn, compared to those interviewed in Summer. In particular, aspects relating to both catering and �toilets� are rated much higher in Autumn, compared to Summer.
The above chart shows satisfaction ratings given by visitors in respect of the various aspects of St James�s Park (the top rated aspects based on �excellent� scores are shown here with the lower rated aspects shown on the following chart).
As with other Parks, St James�s receives high levels of satisfaction for aspects relating to the Park environment, most notably �upkeep of the park� followed by �tidiness and cleanliness�, but lower ratings for �peace and quiet�. Both aspects relating to accessibility to and within the Park also receive relatively high satisfaction scores, with around a third of visitors expressing an opinion respectively rating each of them as �excellent�. Whilst a fifth (18%) of visitors expressing an opinion rate �seating� as �excellent�, a further fifth (13%) rate is as either �poor� or �very poor�.
Most aspects in the chart above are rated more highly by visitors interviewed in Autumn, compared to those interviewed in Summer. In particular, aspects relating to both catering and �toilets� are rated much higher in Autumn, compared to Summer.
36. KPI Performance Ratings: St James�s Park (2 of 2) The above chart shows satisfaction ratings of various aspects of St James�s Park (the bottom rated aspects based on �excellent� scores are shown here with the higher rated aspects shown on the previous chart).
As the chart clearly shows, all aspects relating to both �sports facilities� and catering receive the lowest levels of satisfaction amongst those visitors expressing an opinion. Whilst just 5% of visitors respectively rate �number� and �quality of sports facilities� as �excellent�, approaching a fifth of visitors rate each aspect as �very poor� � this is perhaps unsurprising given that the Park does not offer any formal sports facilities.
Both the �number� and especially the �quality of the catering facilities� achieve relatively low satisfaction ratings.The above chart shows satisfaction ratings of various aspects of St James�s Park (the bottom rated aspects based on �excellent� scores are shown here with the higher rated aspects shown on the previous chart).
As the chart clearly shows, all aspects relating to both �sports facilities� and catering receive the lowest levels of satisfaction amongst those visitors expressing an opinion. Whilst just 5% of visitors respectively rate �number� and �quality of sports facilities� as �excellent�, approaching a fifth of visitors rate each aspect as �very poor� � this is perhaps unsurprising given that the Park does not offer any formal sports facilities.
Both the �number� and especially the �quality of the catering facilities� achieve relatively low satisfaction ratings.
37. KPI Performance Ratings: Green Park (1 of 2) The above chart shows satisfaction ratings given by visitors in respect of the various aspects of Green Park (the top rated aspects based on �excellent� scores are shown here with the lower rated aspects shown on the following chart).
The chart shows that the highest rated aspects relate to issues of accessibility to and within the Park, with �ease of access by chosen method of transport� rated as �excellent� by almost half of all visitors expressing an opinion, and around two fifths giving the same rating in respect of �ease of getting around the Park�.
Aspects relating to the Park environment are rated relatively highly, although lower in comparison to the other three Parks. An area for possible improvement at the Park could be in respect of �Information on Park features�, given that over a third of visitors rate this aspect as either �poor� or �very poor�.
There is some evidence that most aspects of the Park�s operations are more highly rated by visitors interviewed in Autumn, compared to Summer, although differences are not significant � the exception being �activities for adults� which is rated significantly higher in Autumn. In Summer, meanwhile, visitors rate �seating� more highly than in Autumn (62% rate it as either �excellent� or �good�, compared to 48% in Autumn). It may be suggested that this decline in satisfaction amongst visitors interviewed in Autumn may be connected to the removal of deck chairs at this time. The above chart shows satisfaction ratings given by visitors in respect of the various aspects of Green Park (the top rated aspects based on �excellent� scores are shown here with the lower rated aspects shown on the following chart).
The chart shows that the highest rated aspects relate to issues of accessibility to and within the Park, with �ease of access by chosen method of transport� rated as �excellent� by almost half of all visitors expressing an opinion, and around two fifths giving the same rating in respect of �ease of getting around the Park�.
Aspects relating to the Park environment are rated relatively highly, although lower in comparison to the other three Parks. An area for possible improvement at the Park could be in respect of �Information on Park features�, given that over a third of visitors rate this aspect as either �poor� or �very poor�.
There is some evidence that most aspects of the Park�s operations are more highly rated by visitors interviewed in Autumn, compared to Summer, although differences are not significant � the exception being �activities for adults� which is rated significantly higher in Autumn. In Summer, meanwhile, visitors rate �seating� more highly than in Autumn (62% rate it as either �excellent� or �good�, compared to 48% in Autumn). It may be suggested that this decline in satisfaction amongst visitors interviewed in Autumn may be connected to the removal of deck chairs at this time.
38. KPI Performance Ratings: Green Park (2 of 2) The above chart shows satisfaction ratings of various aspects of Green Park (the bottom rated aspects based on �excellent� scores are shown here with the higher rated aspects shown on the previous chart).
As with the other three Parks, Green Park receives relatively low ratings in respect of aspects relating to its catering, �toilets� and �sports facilities�, the latter of which are not formally offered at the Park at present. Where a possible improvement could be made, however, is in relation to the �number of toilets� given that over half of all visitors expressing an opinion rate this aspect as either �poor� or �very poor�.
The �number of catering facilities� is more negatively rated in Summer, compared to Autumn (43% of those expressing an opinion rating them as either �poor� or �very poor�, compared to 16% in Autumn). �Visibility and friendliness of Park staff� is rated more positively in Autumn (48% of those expressing an opinion rating it as either �excellent or �good�, compared with 27% in Summer).
The above chart shows satisfaction ratings of various aspects of Green Park (the bottom rated aspects based on �excellent� scores are shown here with the higher rated aspects shown on the previous chart).
As with the other three Parks, Green Park receives relatively low ratings in respect of aspects relating to its catering, �toilets� and �sports facilities�, the latter of which are not formally offered at the Park at present. Where a possible improvement could be made, however, is in relation to the �number of toilets� given that over half of all visitors expressing an opinion rate this aspect as either �poor� or �very poor�.
The �number of catering facilities� is more negatively rated in Summer, compared to Autumn (43% of those expressing an opinion rating them as either �poor� or �very poor�, compared to 16% in Autumn). �Visibility and friendliness of Park staff� is rated more positively in Autumn (48% of those expressing an opinion rating it as either �excellent or �good�, compared with 27% in Summer).
39. KPI Importance Ratings Visitors were asked to rate how important individual aspects of the Park are to them using a scale of �absolutely vital�, �very important�, �quite important�, �not particularly important� and �not important at all�.
The following two charts show the mean score ratings (out of 5) for each of the four Parks The following eight charts show the distribution of the ratings for each of the four Parks. Please note that figures are based on all visitors expressing an opinion.
In some charts in this section we make comments on priority areas, taking into consideration both the performance and importance ratings. However, the following section in the report, Strategy Matrices, focuses solely on identifying priority areas for improvement.Visitors were asked to rate how important individual aspects of the Park are to them using a scale of �absolutely vital�, �very important�, �quite important�, �not particularly important� and �not important at all�.
The following two charts show the mean score ratings (out of 5) for each of the four Parks The following eight charts show the distribution of the ratings for each of the four Parks. Please note that figures are based on all visitors expressing an opinion.
In some charts in this section we make comments on priority areas, taking into consideration both the performance and importance ratings. However, the following section in the report, Strategy Matrices, focuses solely on identifying priority areas for improvement.
40. Comparison of Parks on KPI Importance Ratings (1 of 2) The chart above shows the mean score importance ratings (out of 5) for all four Parks in respect of aspects relating to park environment, information and staff and catering.
In respect of aspects relating to the Park environment, visitors to al four Parks tend to rate �tidiness and cleanliness� and �upkeep of the park� as highly important. �Peace and quiet� appears to be slightly more important to visitors to the two provincial Parks, than it is for visitors to either of the two Central Parks.
Interestingly, there is far less agreement concerning the importance of the �visibility and friendliness of staff� and �number of catering facilities� across the four Parks, with visitors to Greenwich Park rating both aspects much more importantly than visitors to the other three Parks.
Indeed, visitors to Greenwich Park on the whole place more importance on most of the above aspects, compared to their counterparts visiting the other three Parks. There are also indications that visitors to Greenwich Park rate �information on Park features� and �quality of catering facilities� slightly more importantly than visitors to the other three Parks.
Visitors interviewed at Greenwich Park in Autumn (and expressing an opinion) rate all the above aspects more importantly, than visitors interviewed at the Park in Summer.The chart above shows the mean score importance ratings (out of 5) for all four Parks in respect of aspects relating to park environment, information and staff and catering.
In respect of aspects relating to the Park environment, visitors to al four Parks tend to rate �tidiness and cleanliness� and �upkeep of the park� as highly important. �Peace and quiet� appears to be slightly more important to visitors to the two provincial Parks, than it is for visitors to either of the two Central Parks.
Interestingly, there is far less agreement concerning the importance of the �visibility and friendliness of staff� and �number of catering facilities� across the four Parks, with visitors to Greenwich Park rating both aspects much more importantly than visitors to the other three Parks.
Indeed, visitors to Greenwich Park on the whole place more importance on most of the above aspects, compared to their counterparts visiting the other three Parks. There are also indications that visitors to Greenwich Park rate �information on Park features� and �quality of catering facilities� slightly more importantly than visitors to the other three Parks.
Visitors interviewed at Greenwich Park in Autumn (and expressing an opinion) rate all the above aspects more importantly, than visitors interviewed at the Park in Summer.
41. Comparison of Parks on KPI Importance Ratings (2 of 2) The chart above shows the mean score importance ratings (out of 5) for all four Parks in respect of aspects relating to toilets, other facilities and ease of getting around.
As the chart above clearly shows, visitors to Greenwich Park tend to place more importance on each aspect, compared to those visiting the other three Parks. This is particularly apparent in relation to �facilities for children�, �activities for adults� and for both �number � and �quality� of sports facilities, and to a lesser extent for �number of toilets�.
With the exception of �ease of getting around the Park�, visitors interviewed at Greenwich Park in Autumn (and expressing an opinion) rate all the above aspects more importantly, than visitors interviewed at the Park in Summer.
The chart above shows the mean score importance ratings (out of 5) for all four Parks in respect of aspects relating to toilets, other facilities and ease of getting around.
As the chart above clearly shows, visitors to Greenwich Park tend to place more importance on each aspect, compared to those visiting the other three Parks. This is particularly apparent in relation to �facilities for children�, �activities for adults� and for both �number � and �quality� of sports facilities, and to a lesser extent for �number of toilets�.
With the exception of �ease of getting around the Park�, visitors interviewed at Greenwich Park in Autumn (and expressing an opinion) rate all the above aspects more importantly, than visitors interviewed at the Park in Summer.
42. KPI Importance Ratings: Greenwich Park (1 of 2) The above chart shows importance ratings of various aspects of Greenwich Park (the top rated aspects based on �absolutely vital� ratings are shown here with the lower rated aspects shown on the following chart). The charts also display the highest (green) and lowest (red) rated aspects relating to visitor satisfaction, so that comparisons between importance and performance can be made.
The two most important aspects for visitors to Greenwich Park concern the Park environment, with around a quarter of visitors expressing an opinion respectively rating both the �upkeep of the Park� and �tidiness and cleanliness� as �absolutely vital�. These aspects are closely followed by a range of aspects including �quality of toilets� and �peace and quiet�. Encouragingly, the two most important aspects also receive the highest performance ratings of all the Park�s aspects, with �peace and quiet� also receiving a relatively high performance score. This would suggest the Park is successfully performing against visitors expectations in respect of these two aspects.
However, where the Park seems to be under performing is in the provision of toilet facilities, given that 18% of visitors expressing an opinion rate this aspect as �absolutely vital� although only 8% of visitors rate this aspect as �excellent�.The above chart shows importance ratings of various aspects of Greenwich Park (the top rated aspects based on �absolutely vital� ratings are shown here with the lower rated aspects shown on the following chart). The charts also display the highest (green) and lowest (red) rated aspects relating to visitor satisfaction, so that comparisons between importance and performance can be made.
The two most important aspects for visitors to Greenwich Park concern the Park environment, with around a quarter of visitors expressing an opinion respectively rating both the �upkeep of the Park� and �tidiness and cleanliness� as �absolutely vital�. These aspects are closely followed by a range of aspects including �quality of toilets� and �peace and quiet�. Encouragingly, the two most important aspects also receive the highest performance ratings of all the Park�s aspects, with �peace and quiet� also receiving a relatively high performance score. This would suggest the Park is successfully performing against visitors expectations in respect of these two aspects.
However, where the Park seems to be under performing is in the provision of toilet facilities, given that 18% of visitors expressing an opinion rate this aspect as �absolutely vital� although only 8% of visitors rate this aspect as �excellent�.
43. KPI Importance Ratings: Greenwich Park (2 of 2) The above chart shows importance ratings of various aspects of Greenwich Park (the bottom rated aspects based on �absolutely vital� ratings are shown here, with the top rated aspects shown on the previous chart).
It is clear from the above chart that aspects relating to sports facilities are considered amongst the least important to Greenwich Park visitors.The above chart shows importance ratings of various aspects of Greenwich Park (the bottom rated aspects based on �absolutely vital� ratings are shown here, with the top rated aspects shown on the previous chart).
It is clear from the above chart that aspects relating to sports facilities are considered amongst the least important to Greenwich Park visitors.
44. KPI Importance Ratings: Bushy Park (1 of 2) The above chart shows importance ratings of various aspects of Bushy Park (the top rated aspects based on �absolutely vital� ratings are shown here with the lower rated aspects shown on the following chart). The charts also display the highest (green) and lowest (red) rated aspects relating to visitor satisfaction, so that comparisons between importance and performance can be made.
The three most important aspects for visitors to Bushy Park concern the Park environment, with around a quarter of visitors expressing an opinion respectively rating both the �upkeep of the Park� and �peace and quiet� as �absolutely vital�, closely followed by �tidiness and cleanliness�. These aspects are closely followed by �quality of toilets� and to a lesser extent, �number of toilets�. Encouragingly, the two most important aspects also receive the highest performance ratings of all the Park�s operations. This would suggest the Park is successfully performing against visitors expectations in respect of these two aspects.
However, where the Park seems to be under performing is in the provision of toilet facilities, given that 14% of visitors expressing an opinion rate this aspect as �absolutely vital� although no visitors rate this aspect as �excellent� (8% rate them as �good�). The �quality of catering facilities� would also seem to deserve attention, given that 10% of visitors rate this aspect as �absolutely vital�, whilst just 1% rate it as �excellent�. The chart also shows that whilst visitors rate �ease of access by chosen method of transport� highly (35% rating it as �excellent), this aspect is not considered to be highly important relative to other aspects.
The above chart shows importance ratings of various aspects of Bushy Park (the top rated aspects based on �absolutely vital� ratings are shown here with the lower rated aspects shown on the following chart). The charts also display the highest (green) and lowest (red) rated aspects relating to visitor satisfaction, so that comparisons between importance and performance can be made.
The three most important aspects for visitors to Bushy Park concern the Park environment, with around a quarter of visitors expressing an opinion respectively rating both the �upkeep of the Park� and �peace and quiet� as �absolutely vital�, closely followed by �tidiness and cleanliness�. These aspects are closely followed by �quality of toilets� and to a lesser extent, �number of toilets�. Encouragingly, the two most important aspects also receive the highest performance ratings of all the Park�s operations. This would suggest the Park is successfully performing against visitors expectations in respect of these two aspects.
However, where the Park seems to be under performing is in the provision of toilet facilities, given that 14% of visitors expressing an opinion rate this aspect as �absolutely vital� although no visitors rate this aspect as �excellent� (8% rate them as �good�). The �quality of catering facilities� would also seem to deserve attention, given that 10% of visitors rate this aspect as �absolutely vital�, whilst just 1% rate it as �excellent�. The chart also shows that whilst visitors rate �ease of access by chosen method of transport� highly (35% rating it as �excellent), this aspect is not considered to be highly important relative to other aspects.
45. KPI Importance Ratings: Bushy Park (2 of 2) The above chart shows importance ratings of various aspects of Greenwich Park (the bottom rated aspects based on �absolutely vital� ratings are shown here, with the top rated aspects shown on the previous chart).
It is clear from the above chart that aspects relating to �sports facilities� are considered amongst the least important to Greenwich Park visitors. The above chart shows importance ratings of various aspects of Greenwich Park (the bottom rated aspects based on �absolutely vital� ratings are shown here, with the top rated aspects shown on the previous chart).
It is clear from the above chart that aspects relating to �sports facilities� are considered amongst the least important to Greenwich Park visitors.
46. KPI Importance Ratings: St James�s Park (1 of 2) The above chart shows importance ratings of various aspects of St James�s Park (the top rated aspects based on �absolutely vital� ratings are shown here with the lower rated aspects shown on the following chart). The charts also display the highest (green) and lowest (red) rated aspects relating to visitor satisfaction, so that comparisons between importance and performance can be made.
The two most important aspects for visitors to St James�s Park concern the Park environment, with around a fifth of visitors expressing an opinion respectively rating both the �upkeep of the Park� and �tidiness and cleanliness� as �absolutely vital�. These aspects are closely followed by �peace and quiet�, and aspects relating to �seating�, �accessibility� and �toilets�. Encouragingly, the two most important aspects also receive high performance ratings. This would suggest the Park is successfully performing against visitors expectations in respect of these two aspects.
The above chart shows importance ratings of various aspects of St James�s Park (the top rated aspects based on �absolutely vital� ratings are shown here with the lower rated aspects shown on the following chart). The charts also display the highest (green) and lowest (red) rated aspects relating to visitor satisfaction, so that comparisons between importance and performance can be made.
The two most important aspects for visitors to St James�s Park concern the Park environment, with around a fifth of visitors expressing an opinion respectively rating both the �upkeep of the Park� and �tidiness and cleanliness� as �absolutely vital�. These aspects are closely followed by �peace and quiet�, and aspects relating to �seating�, �accessibility� and �toilets�. Encouragingly, the two most important aspects also receive high performance ratings. This would suggest the Park is successfully performing against visitors expectations in respect of these two aspects.
47. KPI Importance Ratings: St James�s Park (2 of 2) The above chart shows importance ratings of various aspects of St James�s Park (the bottom rated aspects based on �absolutely vital� ratings are shown here, with the top rated aspects shown on the previous chart).
It is clear from this chart that the least performing aspects of the Park � �number of catering facilities� and �sports facilities� � are also considered by visitors to be the least important aspects of the Park�s operations. The above chart shows importance ratings of various aspects of St James�s Park (the bottom rated aspects based on �absolutely vital� ratings are shown here, with the top rated aspects shown on the previous chart).
It is clear from this chart that the least performing aspects of the Park � �number of catering facilities� and �sports facilities� � are also considered by visitors to be the least important aspects of the Park�s operations.
48. KPI Importance Ratings: Green Park (1 of 2) The above chart shows importance ratings of various aspects of Green Park (the top rated aspects based on �absolutely vital� ratings are shown here with the lower rated aspects shown on the following chart). The charts also display the highest (green) and lowest (red) rated aspects relating to visitor satisfaction, so that comparisons between importance and performance can be made.
The two most important aspects for visitors to Green Park concern the Park environment, with around a quarter of visitors expressing an opinion respectively rating both the �upkeep of the Park� and �tidiness and cleanliness� as �absolutely vital�. Encouragingly, �upkeep of the Park� also receives a high performance rating (32% of visitors rate it as �excellent�). This would suggest the Park is successfully performing against visitors expectations in respect of this aspect.
The above chart shows importance ratings of various aspects of Green Park (the top rated aspects based on �absolutely vital� ratings are shown here with the lower rated aspects shown on the following chart). The charts also display the highest (green) and lowest (red) rated aspects relating to visitor satisfaction, so that comparisons between importance and performance can be made.
The two most important aspects for visitors to Green Park concern the Park environment, with around a quarter of visitors expressing an opinion respectively rating both the �upkeep of the Park� and �tidiness and cleanliness� as �absolutely vital�. Encouragingly, �upkeep of the Park� also receives a high performance rating (32% of visitors rate it as �excellent�). This would suggest the Park is successfully performing against visitors expectations in respect of this aspect.
49. KPI Importance Ratings: Green Park (2 of 2) The above chart shows importance ratings of various aspects of Green Park (the bottom rated aspects based on �absolutely vital� ratings are shown here, with the top rated aspects shown on the previous chart).
It is clear from this chart that the least performing aspects of the Park � �number of catering facilities� and �sports facilities�� are also considered by visitors to be amongst the least important aspects of the Park�s operations. �Adults activities� is also considered to be relatively unimportant to visitors. Therefore, allocation of resources to these aspects may not be worthwhile at this time.
The above chart shows importance ratings of various aspects of Green Park (the bottom rated aspects based on �absolutely vital� ratings are shown here, with the top rated aspects shown on the previous chart).
It is clear from this chart that the least performing aspects of the Park � �number of catering facilities� and �sports facilities�� are also considered by visitors to be amongst the least important aspects of the Park�s operations. �Adults activities� is also considered to be relatively unimportant to visitors. Therefore, allocation of resources to these aspects may not be worthwhile at this time.
50. Strategy Matrices
51. Explanation of Strategy Matrices
Strategy matrices are an effective way of identifying how KPI areas may be addressed, given both their importance and performance.
The matrices plot importance (as stated by respondents) versus performance (satisfaction rated by respondents).
The four quadrants of the matrix show which aspects of the Parks� offerings could potentially:
- be improved (Key Action Areas � top left)
- be maintained (Maintain � top right)
- be considered lower priorities (Lower Priorities � bottom left)
- be considered for reallocation of resources (Consider Reallocation of Resources � bottom right)
52. Strategy Matrix � Greenwich Park The above strategy matrix shows that the key action areas for possible improvement are:
�Number of toilets� is the highest priority, given its poor performance but relatively high importance;
�Quality of toilets� is also a high priority for improvement;
�Staff visibility�;
�Catering quality�.
All these areas are perceived to be fairly important to visitors at Greenwich Park, but receive relatively low performance (i.e. satisfaction) ratings.
The Park environment aspects are of paramount performance and therefore it is important that the emphasis on this is maintained, in order to preserve the high satisfaction levels.The above strategy matrix shows that the key action areas for possible improvement are:
�Number of toilets� is the highest priority, given its poor performance but relatively high importance;
�Quality of toilets� is also a high priority for improvement;
�Staff visibility�;
�Catering quality�.
All these areas are perceived to be fairly important to visitors at Greenwich Park, but receive relatively low performance (i.e. satisfaction) ratings.
The Park environment aspects are of paramount performance and therefore it is important that the emphasis on this is maintained, in order to preserve the high satisfaction levels.
53. Strategy Matrix � Bushy Park The above strategy matrix shows that the key action areas for possible improvement are:
�Number of toilets� is the highest priority, given its poor performance but relatively high importance;
�Quality of toilets� is also a high priority for improvement;
�Staff visibility�;
�Catering quality�.
All these areas are perceived to be fairly important to visitors at Bushy Park, but receive relatively low performance (i.e. satisfaction) ratings.
The Park environment aspects are of paramount performance and therefore it is important that the emphasis on this is maintained, in order to preserve the high satisfaction levels.The above strategy matrix shows that the key action areas for possible improvement are:
�Number of toilets� is the highest priority, given its poor performance but relatively high importance;
�Quality of toilets� is also a high priority for improvement;
�Staff visibility�;
�Catering quality�.
All these areas are perceived to be fairly important to visitors at Bushy Park, but receive relatively low performance (i.e. satisfaction) ratings.
The Park environment aspects are of paramount performance and therefore it is important that the emphasis on this is maintained, in order to preserve the high satisfaction levels.
54. Strategy Matrix � St James�s Park The above strategy matrix shows that the key action areas for possible improvement are:
�Quality of toilets� is the highest priority, given its poor performance but relatively high importance;
�Number of toilets� is also a high priority for improvement;
�Catering quality�.
All these areas are perceived to be fairly important to visitors at St James�s Park, but receive relatively low performance (i.e. satisfaction) ratings.
The Park environment aspects are of paramount performance and therefore it is important that the emphasis on this is maintained, in order to preserve the high satisfaction levels.The above strategy matrix shows that the key action areas for possible improvement are:
�Quality of toilets� is the highest priority, given its poor performance but relatively high importance;
�Number of toilets� is also a high priority for improvement;
�Catering quality�.
All these areas are perceived to be fairly important to visitors at St James�s Park, but receive relatively low performance (i.e. satisfaction) ratings.
The Park environment aspects are of paramount performance and therefore it is important that the emphasis on this is maintained, in order to preserve the high satisfaction levels.
55. Strategy Matrix � Green Park The above strategy matrix shows that the key action areas for possible improvement are:
�Quality of toilets� is the highest priority, given its poor performance but relatively high importance;
�Number of toilets� is also a high priority for improvement;
�Information on Park features�.
All these areas are perceived to be fairly important to visitors at Green Park, but receive relatively low performance (i.e. satisfaction) ratings.
The Park environment aspects are of paramount performance and therefore it is important that the emphasis on this is maintained, in order to preserve the high satisfaction levels.The above strategy matrix shows that the key action areas for possible improvement are:
�Quality of toilets� is the highest priority, given its poor performance but relatively high importance;
�Number of toilets� is also a high priority for improvement;
�Information on Park features�.
All these areas are perceived to be fairly important to visitors at Green Park, but receive relatively low performance (i.e. satisfaction) ratings.
The Park environment aspects are of paramount performance and therefore it is important that the emphasis on this is maintained, in order to preserve the high satisfaction levels.
56. Suggestions For Improvement Visitors to all four Parks were asked to spontaneously provide any suggestions for improvement to the Park they were visiting which might increase their enjoyment of it.
The following table shows a list of possible improvements across each Park for ease of comparison. Please note that respondents could provide as many suggestions as they wished.
Then a chart is shown listing the types of events and activities etc. that visitors would like to see offered at the Park in future.Visitors to all four Parks were asked to spontaneously provide any suggestions for improvement to the Park they were visiting which might increase their enjoyment of it.
The following table shows a list of possible improvements across each Park for ease of comparison. Please note that respondents could provide as many suggestions as they wished.
Then a chart is shown listing the types of events and activities etc. that visitors would like to see offered at the Park in future.
57. Suggested Improvements To Parks (Unprompted) Many visitors to each of the four Parks were unable to provide any suggestions for improvement. At St James�s Park, 63% of visitors could not give a suggestion, followed by 47% at Green Park, 42% at Greenwich Park and 26% at Bushy Park. In addition, around a tenth of visitors at each Park respectively stated that the Park was fine/good as it is.
As the table shows, at Greenwich Park, the top most mentioned improvement concerns �more/better parking� (10%). At Bushy Park, meanwhile, �more/better/cleaner toilets� are suggested by around a fifth (18%) of visitors, followed by �improving catering facilities� (13%) and �more dog litter bins/clean up after dogs� (13%). No significant suggestions for improvement are made by visitors to St James�s Park. Finally, at Green Park, visitors most frequently mention �more seating� (11%). It is perhaps unsurprising that visitors to Bushy Park mention �toilets� as an improvement given that the �number of toilets� received the lowest performance ratings of all the Park�s operations. Many visitors to each of the four Parks were unable to provide any suggestions for improvement. At St James�s Park, 63% of visitors could not give a suggestion, followed by 47% at Green Park, 42% at Greenwich Park and 26% at Bushy Park. In addition, around a tenth of visitors at each Park respectively stated that the Park was fine/good as it is.
As the table shows, at Greenwich Park, the top most mentioned improvement concerns �more/better parking� (10%). At Bushy Park, meanwhile, �more/better/cleaner toilets� are suggested by around a fifth (18%) of visitors, followed by �improving catering facilities� (13%) and �more dog litter bins/clean up after dogs� (13%). No significant suggestions for improvement are made by visitors to St James�s Park. Finally, at Green Park, visitors most frequently mention �more seating� (11%). It is perhaps unsurprising that visitors to Bushy Park mention �toilets� as an improvement given that the �number of toilets� received the lowest performance ratings of all the Park�s operations.
58. Educational or Cultural Events and Activities Would Like to See (Prompted with List) Visitors were asked what types of information, educational or cultural activities, if any, they would like the Park to offer from a list shown to them.
Overall, �music events and concerts� are the most frequently mentioned events at all Parks, with the exception of Bushy Park, where it is second most frequently mentioned behind �wildlife events�. Considering that Bushy Park is unusual in its offering of �wilderness� in contrast to the more traditional Park landscape, the provision of �wildlife events� would seem to be appropriate and could prove popular amongst visitors and current non-users. �Theatre/open-air theatre� is also frequently mentioned across all four Parks, and appears to be particularly popular at Greenwich Park (41%).
It must be borne in mind when planning any future events at certain Parks, that a strength of feeling exists that does not want to see any events, most notably at St James�s Park (40%), and to a lesser extent at Green Park (24%). With the exception of Green Park, older visitors are more likely than their younger counterparts to oppose activities and events. For instance, at St James�s Park, 53% of visitors aged 55+ do not want any events at the Park, compared to 30% of under 35s.
At Greenwich Park, music events and concerts are more frequently mentioned by visitors interviewed in Summer, compared to Autumn (56% vs. 38% respectively). At Bushy Park meanwhile, wildlife events, music events, guided walks and educational activities are more frequently mentioned by those interviewed in Autumn, compared to Summer.
Visitors were asked what types of information, educational or cultural activities, if any, they would like the Park to offer from a list shown to them.
Overall, �music events and concerts� are the most frequently mentioned events at all Parks, with the exception of Bushy Park, where it is second most frequently mentioned behind �wildlife events�. Considering that Bushy Park is unusual in its offering of �wilderness� in contrast to the more traditional Park landscape, the provision of �wildlife events� would seem to be appropriate and could prove popular amongst visitors and current non-users. �Theatre/open-air theatre� is also frequently mentioned across all four Parks, and appears to be particularly popular at Greenwich Park (41%).
It must be borne in mind when planning any future events at certain Parks, that a strength of feeling exists that does not want to see any events, most notably at St James�s Park (40%), and to a lesser extent at Green Park (24%). With the exception of Green Park, older visitors are more likely than their younger counterparts to oppose activities and events. For instance, at St James�s Park, 53% of visitors aged 55+ do not want any events at the Park, compared to 30% of under 35s.
At Greenwich Park, music events and concerts are more frequently mentioned by visitors interviewed in Summer, compared to Autumn (56% vs. 38% respectively). At Bushy Park meanwhile, wildlife events, music events, guided walks and educational activities are more frequently mentioned by those interviewed in Autumn, compared to Summer.
59. Decision to Visit Parks Visitors were asked to provide their main purposes or reasons for having visited the Park on the day of the interview. Please note that visitors were not prompted by the interviewer and could provide more than one purpose or reason.Visitors were asked to provide their main purposes or reasons for having visited the Park on the day of the interview. Please note that visitors were not prompted by the interviewer and could provide more than one purpose or reason.
60. Main Reasons for Visiting Park (Unprompted) � Summer and Autumn Combined As the above table clearly shows, visitors provide a wide variety of reasons for visiting the Parks, and reasons differ somewhat according to the Park visitors were interviewed at.
In the main, activities tend to be fairly passive, with sports and exercise based activities playing a lesser role. For instance, half of visitors to Greenwich Park mention �fresh air� and �walking/strolling� (48% respectively), whilst only 12% mention �exercise�, 4% mention �running� and 3% mention �cycling�. At Bushy Park, �fresh air� and �walking/strolling� are still widely mentioned, although the Park also seems to be a popular destination for �walking the dog� (33%) and �bringing children� (27%). In St James�s Park, meanwhile, �peace and quiet� is mentioned by over two thirds of visitors interviewed, followed by �fresh air� (31%). Perhaps unsurprisingly, the highest proportion of visitors to Green Park mention they use it as a �shortcut� (37%), although around 3 in 10 also mention �walking/strolling� and �peace and quiet� respectively.
Cont�d�
As the above table clearly shows, visitors provide a wide variety of reasons for visiting the Parks, and reasons differ somewhat according to the Park visitors were interviewed at.
In the main, activities tend to be fairly passive, with sports and exercise based activities playing a lesser role. For instance, half of visitors to Greenwich Park mention �fresh air� and �walking/strolling� (48% respectively), whilst only 12% mention �exercise�, 4% mention �running� and 3% mention �cycling�. At Bushy Park, �fresh air� and �walking/strolling� are still widely mentioned, although the Park also seems to be a popular destination for �walking the dog� (33%) and �bringing children� (27%). In St James�s Park, meanwhile, �peace and quiet� is mentioned by over two thirds of visitors interviewed, followed by �fresh air� (31%). Perhaps unsurprisingly, the highest proportion of visitors to Green Park mention they use it as a �shortcut� (37%), although around 3 in 10 also mention �walking/strolling� and �peace and quiet� respectively.
Cont�d�
61. Main Reasons for Visiting Park (Unprompted) � Summer and Autumn Combined Cont/d�
There are some notable seasonal differences in terms of the reasons visitors mention for visiting the Parks. At Greenwich Park, 61% of visitors interviewed in the Autumn mention �walking/strolling�, compared to 39% of those interviewed in Summer. Conversely, those interviewed in the Summer are more likely to mention �peace and quiet� (30%), �part of a day�s sightseeing� (16%) and to see the �plants and flowers� (11%). Meanwhile, at Bushy Park, visitors interviewed in Autumn are also more likely to mention �walking/strolling� (38%),, �walking the dog� (43%), �fresh air� (49%) and �exercise (not sports)� (31%), compared to Summer.
The influence of tourism is evident at St James�s Park during the Autumn months with visitors more likely to mention �part of a day�s sightseeing� (21%), �on the way to a visitor attraction� (22%) as well as using the Park as a �shortcut� (30%). Meanwhile in Summer, visitors to St James�s Park are more likely to mention �picnic/lunch/refreshments� (22%) and �peace and quiet� (48%), than those interviewed in Autumn. At Green Park, visitors interviewed in Summer are more likely to mention �peace and quiet�, than those interviewed in Autumn (33% vs 20%).Cont/d�
There are some notable seasonal differences in terms of the reasons visitors mention for visiting the Parks. At Greenwich Park, 61% of visitors interviewed in the Autumn mention �walking/strolling�, compared to 39% of those interviewed in Summer. Conversely, those interviewed in the Summer are more likely to mention �peace and quiet� (30%), �part of a day�s sightseeing� (16%) and to see the �plants and flowers� (11%). Meanwhile, at Bushy Park, visitors interviewed in Autumn are also more likely to mention �walking/strolling� (38%),, �walking the dog� (43%), �fresh air� (49%) and �exercise (not sports)� (31%), compared to Summer.
The influence of tourism is evident at St James�s Park during the Autumn months with visitors more likely to mention �part of a day�s sightseeing� (21%), �on the way to a visitor attraction� (22%) as well as using the Park as a �shortcut� (30%). Meanwhile in Summer, visitors to St James�s Park are more likely to mention �picnic/lunch/refreshments� (22%) and �peace and quiet� (48%), than those interviewed in Autumn. At Green Park, visitors interviewed in Summer are more likely to mention �peace and quiet�, than those interviewed in Autumn (33% vs 20%).
62. The above chart shows when visitor�s took the decision to visit the Park they were interviewed at.
The majority of visits to each of the four Parks are decided on the day.
However, a further 1 in 6 visitors claim to have made the decision the day before and there appears to be some correlation between this pre-planning and longer visit length, at least at the two provincial Parks. For instance, at Greenwich Park 26% of visitors staying for 2 or more hour had planned their visit the day before, compared to 13% of those spending 30 minutes � 2 hours at the Park.The above chart shows when visitor�s took the decision to visit the Park they were interviewed at.
The majority of visits to each of the four Parks are decided on the day.
However, a further 1 in 6 visitors claim to have made the decision the day before and there appears to be some correlation between this pre-planning and longer visit length, at least at the two provincial Parks. For instance, at Greenwich Park 26% of visitors staying for 2 or more hour had planned their visit the day before, compared to 13% of those spending 30 minutes � 2 hours at the Park.
63. Average Length of Visit by Season The above slide shows the average length of visit at each of the four Parks by season.
As can be seen, visits to Parks are around 20% shorter in Autumn, with the exception of Bushy Park, where visit length is identical in both seasons surveyed. At the two provincial Parks, there are some notable differences in visit length depending on the type of activities undertaken in the Park, and group composition. Bringing children to the Park results in longer visits at both Greenwich and Bushy Park. At Bushy Park, males tend to visit longer than females, as do those aged 35 or under. Meanwhile, at Greenwich Park, the more people visiting in a group, the longer the visit is likely to be.
Unsurprisingly, the weather affects the length of visit, with all four Parks experiencing shorter visits on cool/cold days, compared to days of average or warm/hot temperatures. However, only St James�s and Green Park exhibit shorter visits on wet, as opposed to dry days � there are no differences at either Greenwich or Bushy Parks.
Where the decision to visit has been made on the day at both Greenwich and Bushy Park, visits tend to be shorter than when the decision had been made longer before.
The following two slides show visit length by season across each of the four Parks.The above slide shows the average length of visit at each of the four Parks by season.
As can be seen, visits to Parks are around 20% shorter in Autumn, with the exception of Bushy Park, where visit length is identical in both seasons surveyed. At the two provincial Parks, there are some notable differences in visit length depending on the type of activities undertaken in the Park, and group composition. Bringing children to the Park results in longer visits at both Greenwich and Bushy Park. At Bushy Park, males tend to visit longer than females, as do those aged 35 or under. Meanwhile, at Greenwich Park, the more people visiting in a group, the longer the visit is likely to be.
Unsurprisingly, the weather affects the length of visit, with all four Parks experiencing shorter visits on cool/cold days, compared to days of average or warm/hot temperatures. However, only St James�s and Green Park exhibit shorter visits on wet, as opposed to dry days � there are no differences at either Greenwich or Bushy Parks.
Where the decision to visit has been made on the day at both Greenwich and Bushy Park, visits tend to be shorter than when the decision had been made longer before.
The following two slides show visit length by season across each of the four Parks.
64. Visitor Profile (In-park Survey) The following charts show the demographic profile of visitors to each of the four Parks. Please note that each chart is based on aggregated data from the Summer and Autumn wave of interviewing.The following charts show the demographic profile of visitors to each of the four Parks. Please note that each chart is based on aggregated data from the Summer and Autumn wave of interviewing.
65. The above chart shows the age and gender profile of visitors interviewed at each of the four Parks.
Around half of those visitors interviewed at each of the four Parks are aged between 25-44 years old. The average age of visitors to both the provincial Parks is similar, and slightly older, than the average age of visitors to either of the two Central Parks.
There are some differences in the gender profile of visitors interviewed at the four Parks, with those visiting St James�s most likely to be female (57%), and those at Green Park most likely to be male (55%).
The above chart shows the age and gender profile of visitors interviewed at each of the four Parks.
Around half of those visitors interviewed at each of the four Parks are aged between 25-44 years old. The average age of visitors to both the provincial Parks is similar, and slightly older, than the average age of visitors to either of the two Central Parks.
There are some differences in the gender profile of visitors interviewed at the four Parks, with those visiting St James�s most likely to be female (57%), and those at Green Park most likely to be male (55%).
66. The above chart shows the ethnic origin and social grade (based on Chief Income Earner) of those interviewed at each of the four Parks. For convenience, visitors classifying themselves as White-Irish, or White-Other have been assigned to the overall �white� category.
At the two provincial Parks, the vast majority of visitors classify themselves as �white�, whilst there are significant proportions of visitors describing themselves as �European� or from the �Americas� at the two Central Parks � these in turn are most likely to be overseas visitors.
Visitors to all four Parks tend to be more �upmarket� than the profile of the London population as a whole (shown in grey), as well as the UK population as a whole.
Although not charted here, visitors were asked whether they had any illness or disability that affects their daily activities or the work they do. The vast majority of visitors (c.9 in 10) to each of the four Parks claim not to have a limiting illness or disability.
The above chart shows the ethnic origin and social grade (based on Chief Income Earner) of those interviewed at each of the four Parks. For convenience, visitors classifying themselves as White-Irish, or White-Other have been assigned to the overall �white� category.
At the two provincial Parks, the vast majority of visitors classify themselves as �white�, whilst there are significant proportions of visitors describing themselves as �European� or from the �Americas� at the two Central Parks � these in turn are most likely to be overseas visitors.
Visitors to all four Parks tend to be more �upmarket� than the profile of the London population as a whole (shown in grey), as well as the UK population as a whole.
Although not charted here, visitors were asked whether they had any illness or disability that affects their daily activities or the work they do. The vast majority of visitors (c.9 in 10) to each of the four Parks claim not to have a limiting illness or disability.
67. The above chart shows the place of residence for all visitors to each of the four Parks.
Reflecting the ethnic profile of visitors to each of the four Parks, the above chart shows that whilst around two thirds of visitors interviewed at the provincial Parks live in London, high proportions of visitors interviewed at the Central Parks live overseas.
The above chart also shows, for those visitors living outside the UK, the main regions of residence. It should be noted that this is not necessarily an accurate reflection of region of residence since only English language speakers could participate in the survey. Also, please note that the chart only refers to Green Park and St James�s Park given that base sizes for both provincial Parks are too small for analysis.
As the chart shows, around two fifths of overseas visitors at each Park are resident in Western Europe, with a further quarter living in North America/ Canada. Interestingly, there is a significantly higher proportion of overseas visitors resident in Oceania (including Australia and New Zealand) interviewed at St James�s Park (12%), compared to Green Park (5%), whilst those resident in Asia are more likely to have been interviewed at Green Park (11%), compared to St James�s Park.
The above chart shows the place of residence for all visitors to each of the four Parks.
Reflecting the ethnic profile of visitors to each of the four Parks, the above chart shows that whilst around two thirds of visitors interviewed at the provincial Parks live in London, high proportions of visitors interviewed at the Central Parks live overseas.
The above chart also shows, for those visitors living outside the UK, the main regions of residence. It should be noted that this is not necessarily an accurate reflection of region of residence since only English language speakers could participate in the survey. Also, please note that the chart only refers to Green Park and St James�s Park given that base sizes for both provincial Parks are too small for analysis.
As the chart shows, around two fifths of overseas visitors at each Park are resident in Western Europe, with a further quarter living in North America/ Canada. Interestingly, there is a significantly higher proportion of overseas visitors resident in Oceania (including Australia and New Zealand) interviewed at St James�s Park (12%), compared to Green Park (5%), whilst those resident in Asia are more likely to have been interviewed at Green Park (11%), compared to St James�s Park.
68. Group Composition The above chart shows the group composition at each of the four Parks.
Around half of all visitors to the Parks were unaccompanied on the day they were interviewed (40% at St James�s Park). A further two fifths of visitors to each of the four Parks were accompanied by just one other person. Most visitors to all four Parks were not accompanying children on the day of the interview, although Bushy Park exhibits the highest levels of children accompanied by adults aged 16+, with 35% of those interviewed accompanying children on the day of the interview.
The above chart shows the group composition at each of the four Parks.
Around half of all visitors to the Parks were unaccompanied on the day they were interviewed (40% at St James�s Park). A further two fifths of visitors to each of the four Parks were accompanied by just one other person. Most visitors to all four Parks were not accompanying children on the day of the interview, although Bushy Park exhibits the highest levels of children accompanied by adults aged 16+, with 35% of those interviewed accompanying children on the day of the interview.
69. Visitor Telephone Survey
70. Visiting Parks/ Other Places of Interest in London
71. Enjoyment of Visiting Parks/ Other Places of Interest in London Enjoyment of Greenwich Park is highest, followed by Bushy Park and St James�s Park, with Green Park enjoyed least. These findings are broadly similar with those from the In-park Visitors Survey.
Of the other places of interest asked about, Kew Gardens and the Natural History Museum received the highest ratings, and Madam Tussaud�s the lowest.Enjoyment of Greenwich Park is highest, followed by Bushy Park and St James�s Park, with Green Park enjoyed least. These findings are broadly similar with those from the In-park Visitors Survey.
Of the other places of interest asked about, Kew Gardens and the Natural History Museum received the highest ratings, and Madam Tussaud�s the lowest.
72. Frequency of Visiting Parks/ Other Places of Interest in London The chart above shows that Greenwich and Bushy Park are both more frequently visited than St James�s and Green, with around a fifth of users claiming to visit once per week or more. Around a tenth of users at both St James�s and Green Park claim to visit this often, whose visit frequency is similar to Hyde Park.
All parks (including Hyde Park) are visited significantly more frequently than the other places of interest in London asked about in the research. The chart above shows that Greenwich and Bushy Park are both more frequently visited than St James�s and Green, with around a fifth of users claiming to visit once per week or more. Around a tenth of users at both St James�s and Green Park claim to visit this often, whose visit frequency is similar to Hyde Park.
All parks (including Hyde Park) are visited significantly more frequently than the other places of interest in London asked about in the research.
73. Seasons Parks are Visited
74. Day & Time Parks Are Visited
75. Reasons for Visiting and Ways ofEncouraging Visits
76. Reasons for Visiting Parks (Unprompted) The chart above shows that the main (unprompted) reason for visiting all of the Parks is �for a walk�, with between a third and a half naming this. This reason is particularly important for Bushy Park, where a higher proportion visit to walk their dog. Bushy is much less likely to be visited on a trip with family and friends. Around a quarter say they use St James�s and Green Park as a shortcut, significantly less than the proportion saying this for Greenwich and Bushy Parks.
To take the children out is also cited as a relatively important reason for visiting Greenwich and Bushy Parks. Bushy Park is also visited by a relatively large proportion in order to go cycling or to visit the gardens and plants.The chart above shows that the main (unprompted) reason for visiting all of the Parks is �for a walk�, with between a third and a half naming this. This reason is particularly important for Bushy Park, where a higher proportion visit to walk their dog. Bushy is much less likely to be visited on a trip with family and friends. Around a quarter say they use St James�s and Green Park as a shortcut, significantly less than the proportion saying this for Greenwich and Bushy Parks.
To take the children out is also cited as a relatively important reason for visiting Greenwich and Bushy Parks. Bushy Park is also visited by a relatively large proportion in order to go cycling or to visit the gardens and plants.
77. How Could Encourage Visitors to Visit Park More Often (Unprompted) The chart above shows that around a half of respondents interviewed (around two-fifths for Green Park) could not think of anything that could make them visit the Parks more often.
However, �Better/cheaper parking� is named by about a tenth of respondents with respect to Greenwich Park. This is consistent with the suggested improvements from the In-park Visitor Survey.
Around a tenth interviewed about Green Park said Events or Activities would motivate them to visit more often.The chart above shows that around a half of respondents interviewed (around two-fifths for Green Park) could not think of anything that could make them visit the Parks more often.
However, �Better/cheaper parking� is named by about a tenth of respondents with respect to Greenwich Park. This is consistent with the suggested improvements from the In-park Visitor Survey.
Around a tenth interviewed about Green Park said Events or Activities would motivate them to visit more often.
78. Rating of How Parks Improve Quality of Life, Safety Rating, Influence of Weather and Mode of Transport
79. Extent �Park� Improves Quality of Life In The Area
80. The chart above shows that safety in all of the Parks is good. As in the In-park Visitor Survey, Bushy Park is rated less safe than the other three Parks. At Bushy Park females seem to feel more at risk than males with only 44% stating they feel �very safe�, compared to 75% of male respondents. None of the other parks displays this marked contrast in terms of gender.
Furthermore, fewer respondents rate the parks as safe in this survey than in the In-park Visitors Survey (not included in this report). This could be because ratings of safety are boosted when respondents are interviewed in the park itself.The chart above shows that safety in all of the Parks is good. As in the In-park Visitor Survey, Bushy Park is rated less safe than the other three Parks. At Bushy Park females seem to feel more at risk than males with only 44% stating they feel �very safe�, compared to 75% of male respondents. None of the other parks displays this marked contrast in terms of gender.
Furthermore, fewer respondents rate the parks as safe in this survey than in the In-park Visitors Survey (not included in this report). This could be because ratings of safety are boosted when respondents are interviewed in the park itself.
81. The chart above shows that the weather has a significant influence on whether people visit the Parks. This differs from the results in the In-park Visitors Survey (not included in this report), where significantly more claimed the weather did not affect their decision at all or very much. This is most probably because those interviewed in the In-park Visitors Survey were more frequent visitors and therefore less likely to be affected by the weather.The chart above shows that the weather has a significant influence on whether people visit the Parks. This differs from the results in the In-park Visitors Survey (not included in this report), where significantly more claimed the weather did not affect their decision at all or very much. This is most probably because those interviewed in the In-park Visitors Survey were more frequent visitors and therefore less likely to be affected by the weather.
82. Means of Transport to Park The findings in the chart above are different from the findings from those from the In-park Visitors Survey (not included in this report) in a few respects.
Significantly more respondents in this survey claim they walk or cycle to Bushy Park. In addition, significantly more said they drive or take the bus to St James�s and Green Parks.
However, as found in the In-Park Visitor Survey, the majority of visitors travel to both Greenwich and Bushy by car. The principle mode of transport to the Central Parks is by local bus, or Underground.The findings in the chart above are different from the findings from those from the In-park Visitors Survey (not included in this report) in a few respects.
Significantly more respondents in this survey claim they walk or cycle to Bushy Park. In addition, significantly more said they drive or take the bus to St James�s and Green Parks.
However, as found in the In-Park Visitor Survey, the majority of visitors travel to both Greenwich and Bushy by car. The principle mode of transport to the Central Parks is by local bus, or Underground.
83. Visitor Profile (Telephone Survey)
84. The above chart shows the age and gender profile of users of each of the four Parks.
Around half of users of each of the four Parks are aged over 45, rising to three fifths of users of Bushy Park. There are some differences in the gender profile of users of each the four Parks, with those using Greenwich Park most likely to be female (61%), and those at Green Park most likely to be male (48%).
The above chart shows the age and gender profile of users of each of the four Parks.
Around half of users of each of the four Parks are aged over 45, rising to three fifths of users of Bushy Park. There are some differences in the gender profile of users of each the four Parks, with those using Greenwich Park most likely to be female (61%), and those at Green Park most likely to be male (48%).
85. The above chart shows the ethnic origin of users of each of the four Parks. For convenience, users classifying themselves as White-Irish, or White-Other have been assigned to the overall �white� category.
At the two provincial Parks, the vast majority of visitors classify themselves as �white�, whilst there are significant proportions of visitors describing themselves as �European� or from the �Americas� at the two Central Parks.
The above chart also shows the social grade of the chief income earner in the household of users of each Park.
Users of all four Parks appear to be concentrated in the higher ABC1 social grades, and especially those using St James�s Park, and the profile of visitors for all Parks tends to be more �upmarket� than the profile of the London population as a whole. However, it should be noted that the profile of the area where research took place (within an area surrounding the Parks), the social grade profile may well differ from that of London as a whole.
Although not charted here, users were asked whether they had any illness or disability that affects their daily activities or the work they do. The vast majority of users (c.9 in 10) of each of the four Parks claim not to have a limiting illness or disability.
The above chart shows the ethnic origin of users of each of the four Parks. For convenience, users classifying themselves as White-Irish, or White-Other have been assigned to the overall �white� category.
At the two provincial Parks, the vast majority of visitors classify themselves as �white�, whilst there are significant proportions of visitors describing themselves as �European� or from the �Americas� at the two Central Parks.
The above chart also shows the social grade of the chief income earner in the household of users of each Park.
Users of all four Parks appear to be concentrated in the higher ABC1 social grades, and especially those using St James�s Park, and the profile of visitors for all Parks tends to be more �upmarket� than the profile of the London population as a whole. However, it should be noted that the profile of the area where research took place (within an area surrounding the Parks), the social grade profile may well differ from that of London as a whole.
Although not charted here, users were asked whether they had any illness or disability that affects their daily activities or the work they do. The vast majority of users (c.9 in 10) of each of the four Parks claim not to have a limiting illness or disability.
86. The above chart shows the household composition of user of each of the four Parks.
The majority of users of each of the four Parks live within households of between 1 and 2 people. There are, however, some notable differences, with users of Green Park displaying the highest propensity of single person households, and users of Bushy Park least likely to be living alone.
The above chart also shows the ages of children in households with two or more people living in them. As the chart shows, users of each of the four Parks are likely to contain no children, with the exception of Bushy Park, where around half of all households with two or more people do contain children of varying age ranges.The above chart shows the household composition of user of each of the four Parks.
The majority of users of each of the four Parks live within households of between 1 and 2 people. There are, however, some notable differences, with users of Green Park displaying the highest propensity of single person households, and users of Bushy Park least likely to be living alone.
The above chart also shows the ages of children in households with two or more people living in them. As the chart shows, users of each of the four Parks are likely to contain no children, with the exception of Bushy Park, where around half of all households with two or more people do contain children of varying age ranges.
87. Non-Visitor Telephone Survey 11% of potential eligible respondents had not heard of St James�s Park, 15% (Green Park), 7% Bushy Park, 10% (Greenwich Park)11% of potential eligible respondents had not heard of St James�s Park, 15% (Green Park), 7% Bushy Park, 10% (Greenwich Park)
88. Likelihood of Visiting, Reasons for not Visiting and Ways of Encouraging Visits
89. Likelihood of Visiting Parks in The Next 12 Months Across all Parks, it is perhaps unsurprising that non-users visiting park more recently are in turn more likely to visit again in the next 12 months. For instance, 27% of non-users of Greenwich Park last visiting 1-2 years ago are �extremely likely� to visit again in the next 12 months, compared to just 9% of non-users who visited longer ago than 2 years.
There are no other reportable differences in terms of respondent demographics.Across all Parks, it is perhaps unsurprising that non-users visiting park more recently are in turn more likely to visit again in the next 12 months. For instance, 27% of non-users of Greenwich Park last visiting 1-2 years ago are �extremely likely� to visit again in the next 12 months, compared to just 9% of non-users who visited longer ago than 2 years.
There are no other reportable differences in terms of respondent demographics.
90. Reasons for Not Recently/ Never Visiting (Prompted) The chart above shows that the prompted reasons for not visiting the Parks are similar to the unprompted ones.
�Being too busy� is the main reason for not visiting Greenwich, Bushy and St James�s. �Having no reason to visit� is also named as a key reason not to visit each of the four Parks.
�Preferring to go to other parks or places� is another important reason for not visiting St James�s, Green and Bushy Parks.
�Difficulty parking� is named as an obstacle for Greenwich and St James�s Parks in particular.
�Not knowing what to do there� is cited by around a third of respondents with respect to Green Park and around a fifth for the other three Parks.The chart above shows that the prompted reasons for not visiting the Parks are similar to the unprompted ones.
�Being too busy� is the main reason for not visiting Greenwich, Bushy and St James�s. �Having no reason to visit� is also named as a key reason not to visit each of the four Parks.
�Preferring to go to other parks or places� is another important reason for not visiting St James�s, Green and Bushy Parks.
�Difficulty parking� is named as an obstacle for Greenwich and St James�s Parks in particular.
�Not knowing what to do there� is cited by around a third of respondents with respect to Green Park and around a fifth for the other three Parks.
91. How People Could be Encouraged to Visit the Parks (Unprompted) The chart above shows that around three quarters spontaneously mentioned at least one reason that could motivate them to visit the Parks.
Between a tenth and a fifth say that events or activities would attract them to visit the Parks. The chart above shows that around three quarters spontaneously mentioned at least one reason that could motivate them to visit the Parks.
Between a tenth and a fifth say that events or activities would attract them to visit the Parks.
92. How People Could be Encouraged to Visit Parks (Prompted With a List) The chart above shows that when prompted with a list of ways of encouraging people to visit the parks, many reasons receive high mentions.
�Knowing what there is to do in the Parks� is the main mention (by between 39% and 50%) that could motivate people to visit the Parks.
�Parking� is named as a key issue by between a 31% and 42%.
�If it were easier to get to/not so far� is named by between 23% and 43% for each of the Parks.
�Improved toilets� is mentioned by between 23% and 39% for each of the Parks.
�If I felt safe there� is mentioned by between 19% and 26% (highest for Bushy).
The chart above shows that when prompted with a list of ways of encouraging people to visit the parks, many reasons receive high mentions.
�Knowing what there is to do in the Parks� is the main mention (by between 39% and 50%) that could motivate people to visit the Parks.
�Parking� is named as a key issue by between a 31% and 42%.
�If it were easier to get to/not so far� is named by between 23% and 43% for each of the Parks.
�Improved toilets� is mentioned by between 23% and 39% for each of the Parks.
�If I felt safe there� is mentioned by between 19% and 26% (highest for Bushy).
93. Park Activities and Facilities, Rating of How Parks Improve Quality of Life and Influence of Weather
94. Awareness of Activities, Places of Interest, Services and Facilities Offered at Parks The table above shows that awareness (unprompted) of what there is to do among Non-Visitors is not very high.
�Being aware of what the Parks have to offer� is the main factor that could motivate people to visit them (when prompted by a list): between 39% and 50% mention this for each of the Parks.
Greenwich: 41% could not recall anything about the Park and only 22% mention �historical buildings� and an 13% the observatory. None mentioned any of the sports on offer.
Bushy: 47% could not recall anything about it. The children�s playground was the highest mention (25%).
St James�s: 59% could not recall anything about it. Only catering facilities was mentioned by more than 10% (18%).
Green: 70% could not recall anything about it. It is recalled mainly for its footpaths (8%).
The table above shows that awareness (unprompted) of what there is to do among Non-Visitors is not very high.
�Being aware of what the Parks have to offer� is the main factor that could motivate people to visit them (when prompted by a list): between 39% and 50% mention this for each of the Parks.
Greenwich: 41% could not recall anything about the Park and only 22% mention �historical buildings� and an 13% the observatory. None mentioned any of the sports on offer.
Bushy: 47% could not recall anything about it. The children�s playground was the highest mention (25%).
St James�s: 59% could not recall anything about it. Only catering facilities was mentioned by more than 10% (18%).
Green: 70% could not recall anything about it. It is recalled mainly for its footpaths (8%).
95. Activities, Services & Facilities Would Like To See (Unprompted) The chart above shows what activities, services and facilities, if any, that non-visitors would like to see.
A significant proportion of visitors at St James�s Park (40%) and at Green Park (24%), do not want to see any events or activities in the Park.
Music Events and Concerts are the most requested events overall, wanted by a high 48% of those interviewed at Greenwich and about 35% of those at Bushy and Green (36% and 35% respectively), but only 18% at St James�s.
(Open-air) Theatre Events are wanted by a high 41% for Greenwich, 31% for Bushy and 22% for Green (and only 11% for St James�s).
Wildlife Events are requested by a high 45% of those interviewed at Bushy (the most requested event for this Park) and 31% at Greenwich.
Children�s Events, Historical Events and Guided Walks/Talks are requested by around 25% of those in the Greenwich and Bushy surveys.
The chart above shows what activities, services and facilities, if any, that non-visitors would like to see.
A significant proportion of visitors at St James�s Park (40%) and at Green Park (24%), do not want to see any events or activities in the Park.
Music Events and Concerts are the most requested events overall, wanted by a high 48% of those interviewed at Greenwich and about 35% of those at Bushy and Green (36% and 35% respectively), but only 18% at St James�s.
(Open-air) Theatre Events are wanted by a high 41% for Greenwich, 31% for Bushy and 22% for Green (and only 11% for St James�s).
Wildlife Events are requested by a high 45% of those interviewed at Bushy (the most requested event for this Park) and 31% at Greenwich.
Children�s Events, Historical Events and Guided Walks/Talks are requested by around 25% of those in the Greenwich and Bushy surveys.
96. Agreement With Statement � �improves the quality of life in this area� The chart above shows that non-visitors agree strongly overall that the Parks improve the quality of life in the respective areas.
Only 11% of those in the Greenwich Park survey disagree to some extent, and fewer disagree for the other Parks.The chart above shows that non-visitors agree strongly overall that the Parks improve the quality of life in the respective areas.
Only 11% of those in the Greenwich Park survey disagree to some extent, and fewer disagree for the other Parks.
97. Extent to Which Weather Influences Decision To Visit The chart above shows that the weather is very influential in the decision of current non-visitors to visit the Parks. The influence is greater than for visitors (in the In-Park Survey).The chart above shows that the weather is very influential in the decision of current non-visitors to visit the Parks. The influence is greater than for visitors (in the In-Park Survey).
98. Non-Visitor Profile (Telephone Survey)
99. The above chart shows the age and gender profile of non-users to each of the four Parks.
Around half of non-visitors to each of the four Parks are aged over 45, rising to three fifths of users of Bushy Park.
There are some differences in the gender profile of users of each the four Parks, with those not using Greenwich Park most likely to be female (61%), and those not using Green Park most likely to be male (48%).
The above chart shows the age and gender profile of non-users to each of the four Parks.
Around half of non-visitors to each of the four Parks are aged over 45, rising to three fifths of users of Bushy Park.
There are some differences in the gender profile of users of each the four Parks, with those not using Greenwich Park most likely to be female (61%), and those not using Green Park most likely to be male (48%).
100. The above chart shows the ethnic origin of non-users to each of the four Parks. For convenience, non-users classifying themselves as White-Irish, or White-Other have been assigned to the overall �white� category.
For all four Parks, most non-visitors describe themselves as �white�, and especially so in respect of Bushy Park (84%). Amongst those classified as �non-white�, there are fairly high proportions of non-users (8% at Greenwich Park and 9% at Green Park) describing themselves as of �mixed ethnic origin� (e.g. white & black Caribbean, white & black African, white & Asian and other mixed backgrounds).
The above chart also shows the social grade of the chief income earner in the household of non-visitors. Non-visitors of all Parks are slightly less �upmarket� (except Greenwich which is significantly more) than the profile of the London population as a whole. However, it should be noted that the profile of the area where research took place (within an area surrounding the Parks), the social grade profile may well differ from that of London as a whole.
Although not charted here, non-visitors were asked whether they had any illness or disability that affects their daily activities or the work they do. Whilst the vast majority of non-visitors to each of the four Parks claim not to have a limiting illness or disability, the proportion of non-visitors who do are certainly higher than we see in the visitors and users surveys. For instance, whilst only 2% of visitors interviewed at Green Park claim to have a disability or illness, this figure rises to 15% amongst non-visitors � mainly the elderly).
The above chart shows the ethnic origin of non-users to each of the four Parks. For convenience, non-users classifying themselves as White-Irish, or White-Other have been assigned to the overall �white� category.
For all four Parks, most non-visitors describe themselves as �white�, and especially so in respect of Bushy Park (84%). Amongst those classified as �non-white�, there are fairly high proportions of non-users (8% at Greenwich Park and 9% at Green Park) describing themselves as of �mixed ethnic origin� (e.g. white & black Caribbean, white & black African, white & Asian and other mixed backgrounds).
The above chart also shows the social grade of the chief income earner in the household of non-visitors. Non-visitors of all Parks are slightly less �upmarket� (except Greenwich which is significantly more) than the profile of the London population as a whole. However, it should be noted that the profile of the area where research took place (within an area surrounding the Parks), the social grade profile may well differ from that of London as a whole.
Although not charted here, non-visitors were asked whether they had any illness or disability that affects their daily activities or the work they do. Whilst the vast majority of non-visitors to each of the four Parks claim not to have a limiting illness or disability, the proportion of non-visitors who do are certainly higher than we see in the visitors and users surveys. For instance, whilst only 2% of visitors interviewed at Green Park claim to have a disability or illness, this figure rises to 15% amongst non-visitors � mainly the elderly).
101. The above chart shows the household composition of non-visitors to each of the four Parks.
The majority of non-visitors to each of the four Parks live within households of between 1 and 2 people. There are, however, some notable differences, with non-visitors to St James�s Park displaying the highest propensity of single person households, and non-visitors to Bushy Park least likely to be living alone.
The above chart also shows the ages of children in households with two or more people living in them. As the chart shows, non-visitors to each of the four Parks are likely to contain no children, with the exception of St James�s Park, where around two fifths of all households with two or more people do contain children of varying age ranges.
The above chart shows the household composition of non-visitors to each of the four Parks.
The majority of non-visitors to each of the four Parks live within households of between 1 and 2 people. There are, however, some notable differences, with non-visitors to St James�s Park displaying the highest propensity of single person households, and non-visitors to Bushy Park least likely to be living alone.
The above chart also shows the ages of children in households with two or more people living in them. As the chart shows, non-visitors to each of the four Parks are likely to contain no children, with the exception of St James�s Park, where around two fifths of all households with two or more people do contain children of varying age ranges.