Download
1 / 30
310 likes | 471 Views
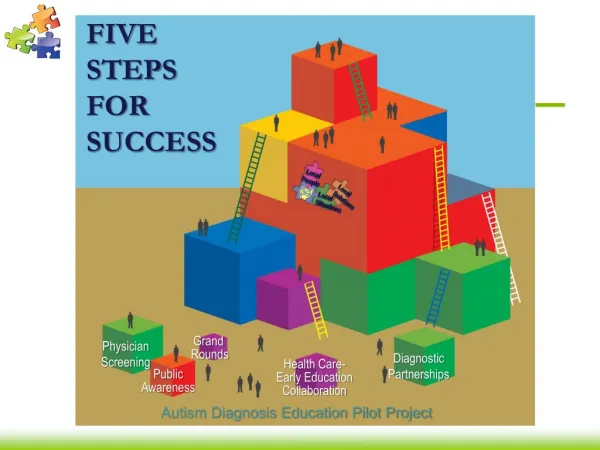
Five Fundamentals for School Success. Consortium on Chicago School Research 2007 Individual Survey Reports Presented by Holly Hart. Today’s Objectives. Learn how to read and interpret the graphs Consider how results can be used for planning and action. Background.

E N D
Five Fundamentals for School Success Consortium on Chicago School Research 2007 Individual Survey Reports Presented by Holly Hart
Today’s Objectives • Learn how to read and interpret the graphs • Consider how results can be used for planning and action
Background • Biannual surveys of students, teachers and principals • Content developed over the years • Developed with broad input and consultation
Survey Administration • Administered in late spring, 2007 • 6th through 10th grade students* • All teachers and principals* • Results are confidential
Survey Returns • Elementary Schools • 77,724 students (6-8th grade) • 11,582 teachers • High Schools • 39,945 students (9-10th grade) • 4,284 teachers
Who Gets a Report? • Schools with at least 42% of teachers responding and/or • Schools with at least 50% of students responding • = 587 schools (92%)
Framework of the Essential Supports and Contextual Resources for School Improvement
Impact of the Essential Supports • Schools strong in 3-5 essential supports were 10 times more likely to show increasing reading gains than schools strong in only 1-2 supports.
Impact in High Schools • In recent report, What Matters for Staying On-Track and Graduating in Chicago Public High Schools… • Grades, failures and absence rates were better than expected, given the students served by the school, in schools with (1) supportive relationships between teachers and students, and (2) a perception among students that the work they were doing in high school was preparing them for the future.
What is a Scale? • Combines questions that • Fit together conceptually (same idea) • Fit together statistically • Summarizes the data • More reliable than a single item
Program Coherence Teachers agree or disagree that: • You can see continuity from one program to another • Many special programs come and go • Once we start a new program, we follow up with it • Curriculum and instruction are well coordinated across grades • We have so many programs that I can’t keep track • Curriculum and instruction are consistent among teachers in the same grade • Coordination/focus of instruction has changed for better in last 2 years
Value of Your School Reports • Not what CCSR thinks but… • How the teachers and students from your school responded • Anonymous responses • More comprehensive view • Focused areas of inquiry and methodologically sound scales
Essential Supports for School Improvement Five Fundamentals for School Success
Reading Five Fundamentals Diagram • 5 colors based on distance from CPS average • Lack of data
Performance on Five Fundamentals • Your school’s unique performance on five fundamentals • Quick impression of performance • Each box represents the average of all scales • Also shows performance on sub-components of each fundamental • Compared to CPS norms
Reading Individual scales • Performance is more mixed than overall diagram implies • Some strengths, some weaknesses (Academic press, Academic Engagement, etc)
Two Reports • Summary • Details
Program Coherence System Schools like yours
Details Report • Lists all the questions that went into the scale • Compares your school’s responses on each question to the system • Shows the variation among your students/teachers on each scale • Gives more information about why your school may be high or low on a scale
System Program Coherence
Program Coherence None Little Moderate Strong
Program Coherence None 2 Little 3 Moderate 4 Strong
Conclusion Individual Survey Reports: • Can help you learn more about strengths and weaknesses at your school • Can provide a tool for identifying and explaining issues that you would like to address
For more information • Consortium Survey Office • 773-834-3629 • ccsr-survey@uchicago.edu • Actual surveys and more information on our website: http://ccsr.uchicago.edu