Download
1 / 52
520 likes | 685 Views
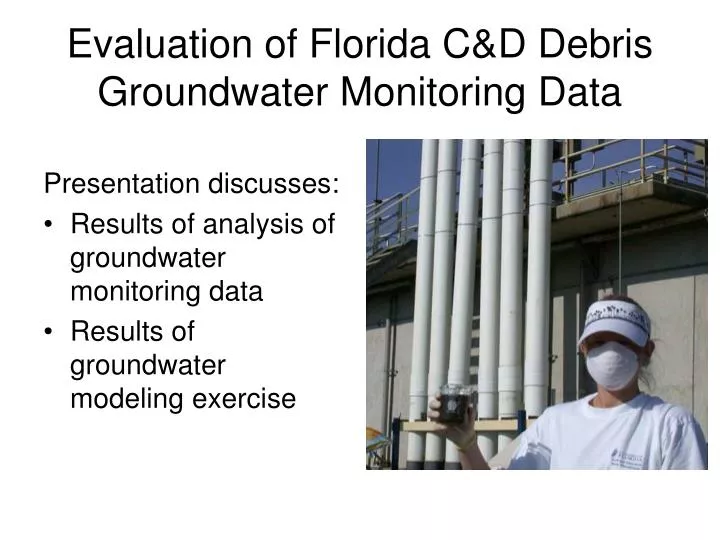
Evaluation of Florida C&D Debris Groundwater Monitoring Data. Presentation discusses: Results of analysis of groundwater monitoring data Results of groundwater modeling exercise. Groundwater Monitoring Data. Original data set from FDEP Primarily results from 1997 through 1999

E N D
Evaluation of Florida C&D Debris Groundwater Monitoring Data Presentation discusses: • Results of analysis of groundwater monitoring data • Results of groundwater modeling exercise
Groundwater Monitoring Data • Original data set from FDEP • Primarily results from 1997 through 1999 • Additional data were collected by UF • Electronically from the district • Hardcopy upon visiting the district • Most recent data: • End of 2002 • Beginning of 2003
Data Evaluation Approach • Step 1: Identify parameters of concern • Eliminate those inorganic parameters that were rarely detected and also rarely exceeded a target level • Eliminate those organic parameters that never exceeded a target level • Remaining parameters: 20
Data Evaluation Approach • Step 2: Comparison of Upgradient and Downgradient Wells for Pooled Data Set • If greater than 50% of the data were above detection limit • Tolerance Limit Test • If less than 50% of the data were above detection limit • Test of Proportions
Results of Test of Proportion • The proportion of samples above the detection limit in the downgradient samples was higher than the proportion above the detection limit in the upgradient samples for: • Arsenic, cadmium, manganese, benzene, total phenols, vinyl chloride
Graphical Comparison of the Data • Box and wisker plots were compared for the upgradient and downgradient wells. 90thPercentile 75thPercentile Median 25thPercentile 10thPercentile
Data Evaluation Approach • Step 3: Assess the frequency at which groundwater cleanup target levels are exceeded. • For parameters of concern, calculate the number of sites where a parameter exceeds a target level in a downgradient well where that same parameter it is not exceeded in an upgradient well. • Only 74 of the 81 sites could be used. Some sites did not have appropriate background wells.
Of the 74 sites evaluated, 69 sites had at least one exceedance for one parameter in a downgradient well that was not also exceeded in an upgradient well.
Data Evaluation Approach • Step 4: Look at the data for the sites to see where exceedances are consistent, and where exceedances are one-time or sporadic.
Next Steps • Statistical comparison of individual site data • Look at confounding issues such as turbidity • Examine site histories
Modeling Exercise • Potential groundwater contamination at C&D debris landfills has been assessed using a simple analytical model. • Objective was to examine the range of potential groundwater concentrations that might be encountered. • No specific site was assessed.
MYGRT • Sponsored by EPRI • Developed by Tetra Tech Inc. • Used in past by wood preservation industry
MYGRT • The MYGRT Code Version 3 is an interactive, menu-driven code for microcomputers. The code predicts the migration of both inorganic and organic solutes in the unsaturated and saturated zones down gradient of sources (i.e. waste disposal sites or spills). The processes included are advection, dispersion, retardation, and decay. The code can simulate problems in one, two, or three dimensions using either horizontal or vertical views.
Key Model Assumptions • Source concentration • Vertical Infiltration Rate • Retardation factor in unsaturated zone • Aquifer characteristics • Gradient • Hydraulic conductivity • Depth • Retardation factor in aquifer
Consider an Example • 700 ft by 700 ft landfill • Examine different scenarios • Use ones outlined in FDEP’s unimpeded discharge study • Use simulated landfill column data for the source term • Examine impact of two prime variables • Hydraulic conductivity of the aquifer • Retardation factor
Scenarios • Coastal Flatland • Gradient 0.001 ft/ft • Hydraulic conductivity 10-7 – 10-3 cm/sec • Upland Flatland • Gradient 0.001 ft/ft • Hydraulic conductivity 10-7 – 10-3 cm/sec • Limestone • Gradient 0.005 ft/ft • Hydraulic conductivity 10-5 – 10-3 cm/sec
Source Leachate Assumptions: Simulated C&D Debris LandfillsContaining CCA-Treated Wood
Input Arsenic Concentration • Arsenic = 2.05 mg/L • Contributed leachate for 20 years