Download
1 / 1
10 likes | 227 Views
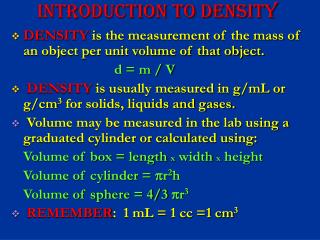
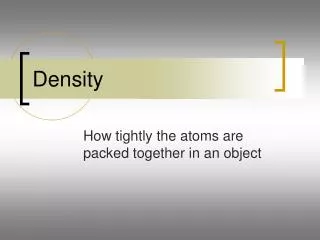
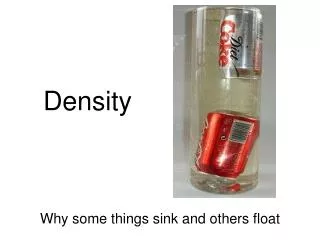
Colligative Properties of a Binary Liquid: Cyclohexane & 2-Propanol A. Sinclair, C. Jordan ( Grunst ), & U. Dennis Washington State University, Chemistry 335. Density Introduction

E N D
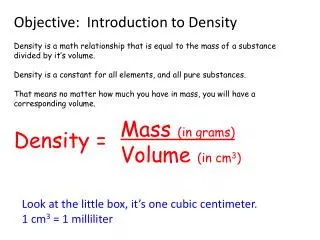
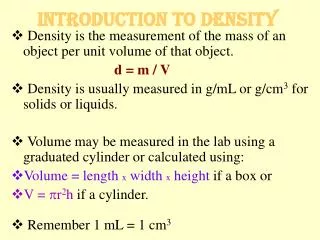
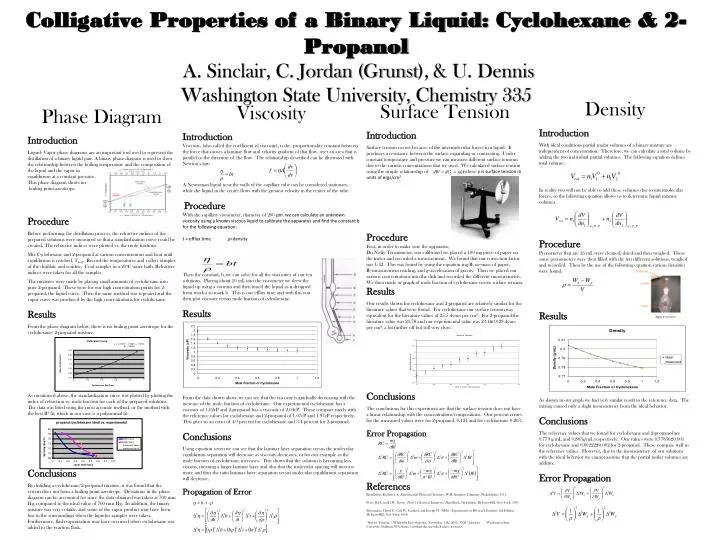
Colligative Properties of a Binary Liquid: Cyclohexane & 2-Propanol A. Sinclair, C. Jordan (Grunst), & U. Dennis Washington State University, Chemistry 335 Density Introduction With ideal conditions partial molar volumes of a binary mixture are independent of concentration. Therefore, we can calculate a total volume by adding the two individual partial volumes. The following equation defines total volume: In reality you will not be able to add these volumes due to intermolecular forces, so the following equation allows us to determine liquid mixture volumes. Procedure Pycnometer that are 25 mL were cleaned, dried and then weighed. These same pycnometers were then filled with the ten different solutions, weighed and recorded. Then by the use of the following equation various densities were found. Results As shown in our graph we had very similar result to the reference data. The mixing caused only a slight inconsistency from the ideal behavior. Conclusions The reference values that we found for cyclohexane and 2-propanol are 0.779 g/mL and 0.803g/mL respectively. Our values were 0.77836±0.001 for cyclohexane and 0.80222±0.002 for 2-propanol. These compare well to the reference values. However, due to the inconsistency of our solutions with the ideal behavior we cannot assume that the partial molar volumes are additive. Error Propagation Surface Tension Introduction Surface tension occurs because of the intermolecular forces in a liquid. It produces a resistance between the surface expanding or contracting. Under constant temperature and pressure we can measure different surface tensions due to the various concentrations that we used. We calculated surface tension using the simple relationship of where γ is surface tension in units of ergs/cm2. Procedure First, in order to make sure the apparatus, Du Noűy Tensiometer, was calibrated we placed a 100 mg piece of paper on the meter and recorded a measurement. We found that our correction factor was 1.42. This was found by using the equation mg/R; m=mass of paper, R=measurement reading, and g=acceleration of gravity. Then we placed our various concentrations into the dish and recorded the different measurements. We then made or graph of mole fraction of cyclohexane versus surface tension. Results Our results shown for cyclohexane and 2-propanol are relatively similar for the literature values that were found. For cyclohexane our surface tension was equivalent for the literature values of 25.5 dynes per cm2. For 2-propanol the literature value was 23.78 and our experimental value was 23.1±0.029 dynes per cm2, a bit further off but still very close. Conclusions The conclusions for this experiment are that the surface tension does not have a linear relationship with the concentrations/compositions. Our percent errors for the measured values were for 2-propanol, 0.421 and for cyclohexane 0.203. Error Propagation References Bettelheim, Frederick A. Experimental Physical Chemistry. W.B. Saunders Company, Philadelphia: 1971. Perry, R.H, and D.W. Green. Perry’s Chemical Engineers’ Handbook. 7th Edition. McGraw-Hill, New York: 1997. Shoemaker, David P., Carl W. Garland, and Joseph W. Nibler. Experiments in Physical Chemistry. 6th Edition. McGraw-Hill, New York: 1996. “Surface Tension.” Wikipedia Encyclopedia. November 15th, 2006. WSU Libraries. Washington State University, Pullman, WA.<http://en.wikipedia.org/wiki/Surface_tension>. Viscosity Introduction Viscosity, (also called the coefficient of viscosity), is the proportionality constant between the force that causes a laminar flow and velocity gradient of that flow, over an area that is parallel to the direction of the flow. The relationship described can be illustrated with Newton’s law: A Newtonian liquid near the walls of the capillary tube can be considered stationary, while the liquid in the center flows with the greatest velocity in the center of the tube. Procedure With the capillary viscometer, diameter of 200 µm, we can calculate an unknown viscosity using a known viscous liquid to calibrate the apparatus and find the constant b for the following equation: t = efflux time ρ=density Then the constant, b, we can solve for all the viscosities of our ten solutions. Placing about 10 mL into the viscometer we drew the liquid up using a vacuum and then timed the liquid as it dropped from mark a to mark b. This is our efflux time and with this you then plot viscosity versus mole fraction of cylcohexane. Results From the data shown above we can see that the viscosity is gradually decreasing with the increase of the mole fraction of cyclohexane. Our experimental cyclohexane has a viscosity of 1.02cP and 2-propanol has a viscosity of 2.04cP. These compare nicely with the reference values for cyclohexane and 2-propanol of 1.07cP and 1.97cP respectively. This gives us an error of 4.9 percent for cyclohexane and 3.4 percent for 2-propanol. Conclusions Using equation seven we can see that the laminar layer separation versus the molecular equilibrium separation will decrease as viscosity decreases, or for our example as the mole fraction of cyclohexane increases. This shows that the solution is becoming less viscous, meaning a larger laminar layer and also that the molecular spacing will increase more and thus the ratio laminar layer separation versus molecular equilibrium separation will decrease. Propagation of Error Phase Diagram Introduction Liquid- Vapor phase diagrams are an important tool used to represent the distillation of a binary liquid pair. A binary phase diagram is used to show the relationship between the boiling temperature and the composition of the liquid and the vapor in equilibrium at a constant pressure. This phase diagram shows no boiling point azeotrope. Procedure Before performing the distillation process, the refractive indices of the prepared solutions were measured so that a standardization curve could be created. The refractive indices were plotted vs. the mole fractions. Mix Cyclohexane and 2-propanol at various concentrations and heat until equilibrium is reached, Tboil. Record the temperatures and collect samples of the distillate and residue. Cool samples in a 20oC water bath. Refractive indices were taken for all the samples. The mixtures were made by placing small amounts of cyclohexane into pure 2-propanol. These were for our high concentration points for 2-propanol, the liquid curve. Then the same method was repeated and the vapor curve was produced by the high concentrations for cyclohexane. Results From the phase diagram below, there is no boiling point azeotrope for the cyclohexane/ 2-propanol mixture. As mentioned above, the standardization curve was plotted by plotting the index of refraction vs. mole fraction for each of the prepared solutions. The data was fitted using the most accurate method, or the method with the best R2 fit, which in our case is a polynomial fit. Conclusions By distilling a cyclohexane/2-propanol mixture, it was found that the system does not form a boiling point azeotrope. Deviations in the phase diagram can be accounted for since the data obtained was taken at 700 mm Hg, compared to the ideal value of 760 mm Hg. In addition, the binary mixture was very volatile, and some of the vapor product may have been lost to the surroundings when the liquidus samples were taken. Furthermore, flash vaporization may have occurred when cyclohexane was added to the reaction flask.