Download
1 / 47
470 likes | 836 Views
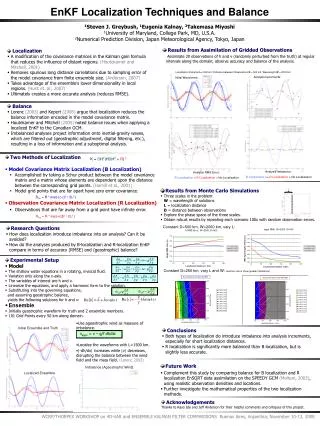
Co-Localization of Proteins – Standard Techniques and Biophysical Approaches. Debra Ann Fadool Harianto Tjong 30 November 2007. Physiological Context for Protein Interaction Studies and Co-localization.

E N D
Co-Localization of Proteins –Standard TechniquesandBiophysical Approaches Debra Ann Fadool Harianto Tjong 30 November 2007
Physiological Context for Protein Interaction Studies and Co-localization • Estimated that there are ~500,000 proteins in the human body and approximately 10,000 can be produced by a single cell. • Estimated that 80% of ALL proteins DO NOT exist in isolation, but rather exist in a protein complex. • Protein-protein interactions are contained in cellular networks known as “hubs” with connecting “nodes”. • Gene-targeted deletion of a major node within a given hub = “Central-lethality Rule”.
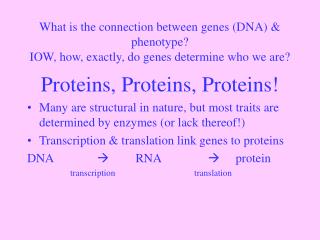
Protein-protein Interactions Fall within the Study of Proteomics • Association of proteins in stable or transient complexes, generally determine a linked function in a cascade. • The binding of one signaling protein to another can recruit proteins to a subcellular location. • Interactions between proteins can introduce necessary conformational changes required for protein activity. • Binary protein-protein interactions are the cornerstone of signal transduction. • Higher-order assemblages or scaffolds provide efficiency of the transmission of the signal.
How does one identify and characterize protein-protein interactions? • Standard Techniques Glutathione-S-Transferase Fusion Proteins Affinity Tags Tandem Affinity Purification (TAP) Tags Strep-Tag III Quantitative Proteomics Chemical Crosslinking Two-hybrid Yeast Phage-display • Universal Verification of Interaction Techniques Co-Immunoprecipitation Confocal Microscopy • Public Protein-Protein Interaction Databases • Biophysical Verification of Interaction Techniques Fluorescence Resonance Energy Transfer (FRET) GFP-Protein Proximity Imaging Microscopy (GFP-PRIM) Mass Spectroscopy (MS) Atomic Force Microscopy (AFM) Surface Plasmon Resonance (SPR)
Standard Techniques • Glutathione-S-Transferase Fushion Proteins (GST-Pull Down Assays) • GST-fusion protein is expressed and affinity • purified in bacteria. This is your bait protein. • Then mix your GST-fusion protein with cell • lysate to bind interaction partner. • Purify interacting protein using GST beads • or a SwellGel Disc. • Run samples out on SDS-PAGE • Good for interactions in solution • Far Western Analysis – • Use GST 32P labeled fusion protein and then • cleave off the GST. • Probe an expression library or SDS-Page • nitrocellulose and scan for radioactive band. • 7. Limitation: Completely in vitro
Standard Techniques • Affinity Tags for Purification of Protein Complexes • This is a genetically-fused affinity tag. • Cells are transfected with the plasmid • containing the bait protein and the tag. • The bait protein and associated partners • are then isolated using a solid support for the • specific tag. • Advantage: can be greater than binary. • Advantage: can have post-translational • modifications that can increase complexes • (such as phosphorylation). • Disadvantage: non-physiological targets • can combine or two proteins from different • cells or subcellular compartments. • 7. Concept of: “Macromolecular Crowding”
Standard Techniques • Affinity Tags for Purification of Protein Complexes • Disadvantage: can be highly biased • toward proteins of high abundance in a cell. • Disadvantage: the tag might even affect • the subcellular localization in a cell or its • protein partner. • Solution? = Put tags in different places • within the bait protein. • Solution? = Use Two Sequential • Affinity Tags not One…. • This is called TAP- method
Standard Techniques • Tandem Affinity Purification (TAP) Method • There is a TEV cleavage site between the • tandem tags. • After binding to putative protein partner, • run over a column using protein A (first tag), • then cleave, and run over a second column • using CHP/SBP/Strep II (second tag) - • Thus you have a double purifcation. • Disadvantages: need large starting material • for double purification and cannot capture • transient protein partners.
Standard Techniques • Strep-tag III • These are the most commonly used • and commercially available tags packaged • in kits with the antisera. • Small peptide tags = called epitope tagging • Flag-tag, Myc-tag, Lap-tag, or HA-tag. • Advantage: Small tag is less likely to • Interfere with binding of protein partner. • 18. Disadvantage: Is good for even low-afinity • binding targets but this can also increase • non-specific background.
Using Epitope Tags to Look at Membrane Localization Untagged Channel Routine Immunoprecipitation (IP) and C-IP; Native and Cloned N-terminal GFP Tagged Channel Total Channel Expression S1/S2 Extracellular Myc Tagged Channel Surface Channel Expression
How Do Tags Reveal Protein Subcellular Localization? Total Channel Expression Surface Channel Expression Kv1.3 Kv1.3 TrkB Kv1.3 TrkB nShc Kv1.3 TrkB Kv1.3 TrkB nShc Kv1.3
Imaging channel localization using multiple tags (Kv1.3-myc-GFP) combined image (DAPI: nucleus) c-myc: cell surface GFP: total channel
Standard Techniques • Quantitative Proteomics • Culture cells in media supple- • mented with labelled amino acids • or radioactive probes. • Differentially label proteins with • metabolic or isotope tags. • Non-specific vs. specific protein • partners can be distinquished based • upon intensity of the peaks • observed under MS. A = SILAC = Metabolic labelling technique B = ICAT = Isotope-coded affinity tag
Standard Techniques • Oldest technique to study protein-protein • Interactions (> 50 years). • 2. Completely empirical: never know which • proteins can be crosslinked and by which • chemical reagents! • “The absence of evidence is not • necessarily evidence of absence.” • Some linkers are photoactivatable so can • study kinetics of dynamic interactions. • Can also determine distance between • protein partners dependent upon the chemistry • of the linker (zero-length cross-linkers; molecular • rulers, and nearest neighbors). • After crosslink, analysis by SDS-PAGE, • peptide mapping by HPLC, MS, or affinity • purifcation. • Chemical Crosslinking
Standard Techniques BD = binding to promoter DNA sequence AD = binding to DNA that activates transcription When bait and partner bind, then creates intact and functional transcription regulator to induce production of reporter gene product. • Yeast Two-Hybrid • Advantage = Unknown target partners • can be discovered via “fishing”. • Advantage = Transient and weak • interactions can be detected using the • genetic reporter system. • Disadvantage = 50% False Positives! • Disadvantage = only binary interactions • Yeast does not = Mammal
Must Validate all Protein-protein Interactions by Multiple Methods! • Due to false positives, only 10% of the entire human interaction maps are complete! Types of Validation Approaches: • Confocal Microscopy • Co-Immunoprecipitation • Surface Plasmon Resonance • Spectroscopy
Verification of Interaction Techniques A. Confocal Microscopy for Subcellular Co-localization • Core facility equipment. • Can be native or • cloned protein partners.
Verification of Interaction Techniques • B. Reciprocal Co-Immunoprecipitation • Incubate with antiserum directed • against bait protein, SDS-PAGE, • then probe with partner antiserum. • Repeat in opposite direction. • Advantage = Gold Standard • Disadvantage = Must have • antisera source to proteins of interest
Protein-protein Interaction Databases • http://www.piercenet.com/Products/Browse.cfm?fldID=A6C04192-4535-4618-B372-98D97A7A21F8 (Great Technical Resource) • iHOP http://www.ihop-net.org/UniPUb/iHOP/ • IntAct http://www.ebi.ac.uk/intact
Biophysical Approaches • C. Surface Plasmon Resonance (SPR) • Calculation of the microscopic rate • constants for interaction between proteins. • Doesn’t have to be p-p but can be protein- • nucleic acid, protein-ligand, or protein- • nanoparticles. • One interaction partner (Y) is bound to the • metal film while the other (red balls) partner • Is injected over the surface. • Amount of bound protein is quantified • based upon angle of reflected light. • Real time association and dissociation • of a protein-protein interaction can be • quantified.
Biophysical Approaches • Surface Plasmon Resonance (SPR) Plus Ca2+ No Ca2+ 2 Control, Non-interacting Proteins
Biophysical Approaches • Surface Plasmon Resonance (SPR) High-Throughput to Determine Multiple Ligand Interacting Molecules
Biophysical Approaches • D. Atomic Force Microscopy • Rather than binding affinities or rate constants • of association, will directly measure the forces • involved in creating and maintaining a p-p • Interaction. • Can be used to measure dynamic strength • and characterize free energy released during • breakage of a p-p interaction complex. • Uses a cantilever that flexibly bends according • to the topographical contour of the specimen • scanned. • Atomic-level resolution is reached by • translating the deflection of the cantilever into • an image map of surface height differences. • Then perform computer reconstruction to achieve • final image. • How we know that Streptavidin-biotin strongest • protein-protein interaction to date (300 piconewtons) Most Used for Receptor-Ligand Interactions
How does one identify and characterize protein-protein interactions? • Standard Techniques Glutathione-S-Transferase Fusion Proteins Affinity Tags Tandem Affinity Purification (TAP) Tags Strep-Tag III Quantitative Proteomics Chemical Crosslinking Two-hybrid Yeast Phage-display • Universal Verification of Interaction Techniques Co-Immunoprecipitation Confocal Microscopy • Public Protein-Protein Interaction Databases • Biophysical Verification of Interaction Techniques Fluorescence Resonance Energy Transfer (FRET) GFP-Protein Proximity Imaging Microscopy (GFP-PRIM) Mass Spectroscopy (MS) Atomic Force Microscopy (AFM) Surface Plasmon Resonance (SPR)
FRET • What is FRET? • How it works • What is it for? • Example
Förster/Fluorescent Resonance Energy Transfer Fluorescence: • a luminescence phenomenon in which the molecular absorption of a photon triggers (almost spontaneously) the emission of another photon with a longer wavelength. • The energy difference of these photons are converted to molecular vibrations or heat. • Quantum yield = (# of photons emitted) / (# of photons absorbed) • Lifetime refers to the average time the molecule stays in its exited state before emitting a photon. Energy Transfer involves 2 different fluorescent molecules (fluorophores): donor (D) and acceptor (A)
The key is non-radiative • FRET: a non-radiative, dipole-dipole coupling process, transfer energy from an excited donor fluorophore to an acceptor fluorophore in very close proximity (typically within 10nm) Nat. Rev. Mol. Cell Biol. 4, 579 (2003)
The Förster theoryFörster, T. (1948) Zwichenmolekulare energiewanderung und fluoreszenz. Annalen der Physik 2, 55-75. The rate at which Förster energy transfer occurs is given by: Efficiency varies as the sixth power of the distance between D – A
The Förster theoryFörster, T. (1948) Zwichenmolekulare energiewanderung und fluoreszenz. Annalen der Physik 2, 55-75. Förster distance, R0, is the distance at which 50% energy transfer takes place, depends on • quantum yield (Q) of the donor • relative orientation of the transition dipoles of the two fluorophores, k2. • acceptor extinction coefficient, e. • Spectral overlap between D emission and A absorption, J. • Refractive index of medium, n, usually for water solvent: 1.4
Example: the emission and absorption spectra of cyan fluorescent protein (CFP, the donor) and yellow fluorescent protein (YFP, the acceptor), respectively. CFP & YFP pair is currently the ‘best’ for FP-based FRET.
The theory supporting energy transfer is based on the concept of treating an excited fluorophore as an oscillating dipole that can undergo an energy exchange with a second dipole having a similar resonance frequency • K2 is the degree of alignment: D emission dipole & A absorption dipole, ranging from 0 to 4 • maximum if the two dipoles are both parallel and collinear • 0 if perpendicular • 2/3 is usually assumed, which is the average value integrated over all possible angles • because of the sixth-root relationship to the Förster distance, a variation from 1-4 produces ~26% change
(1) 5-(2-iodoacetylaminoethyl)aminonaphthalene-1-sulfonic acid(2) N-(4-dimethylamino-3,5-dinitrophenyl)maleimide(3) carboxyfluorescein succinimidyl ester(4) 4,4-difluoro-4-bora-3a,4a-diaza-s-indacene http://www.olympusfluoview.com/applications/fretintro.html
Molecular Ruler Thanks to its high resolution, FRET has been used to measure protein-protein interactions between 2 FP-labeled proteins.
Biosensors FRET is well-suited to study protein interactions. FRET also can be useful to study kinetics of association/dissociation between macromolecules
Problems • The D and A fluorophores might be different brightness. • D:A stoichiometry is outside the range of 1:10 – 10:1 • Cross-talk or bleed-through between the 2 fluorophore colors: • Direct excitation of A. • D emits fluorescence that leaks into detection channel for A fluorescence.
Problems • FRET signals reduces if D & A are not aligned or not within R0 Structure of GFP which occupies much of the useful FRET distance.
Simultaneous optical and electrical recording of single gramicidin channels.Biophys. J. 84, 612 (2003) Central aim: to test the feasibility of combined optical and electrical recording measurements in a configuration that could prove applicable to the study of a wide range of ion channels.
System: Gramicidin A • Has served as a model system for understanding fundamental aspects of ion channels for more than 30 years. • Was the first channel for which a primary structure was determined. • Was the first defined substance of which single-channel currents were observed via electrical recording. • Was the 1st channel for which the 3D structure of the conducting form was determined. • The gating event (channel opening) is widely believed to be the dimerization of peptides in the membrane.
Dimerization results in a pathway for ions Due to the symmetric composition of both membrane leaflets, dimers can be Cy3/Cy3 or Cy5/Cy5 or Cy3/Cy5
FRET is expected to occur only with a current of 1.65 – 1.75 pA at 100mV
Uncorrelated electrical and optical events • FRET signals observed even when non-ion channels were detected electrically. • Possibilities: • dimer formed in a non-bilayer part • occurrence of the low-conductance double-stranded dimers. • non-conducting dimeric intermediate was observed. -> Advantage of single molecule imaging.
Uncorrelated electrical and optical events • Electrical signals were observed without FRET. • Possibilities: • dimer formed outside the imaging area • photo-destruction of the donor without affecting the conductance properties of the channel. • inefficient FRET because some dyes were not freely rotating, or to far from optimum distance.
Trajectories from red spots: diffusion coefficient estimation for the dimeric channel