Download
1 / 62
630 likes | 1.21k Views
Chapter 2: Descriptive Statistics 2.1 Organizing Qualitative Data 2.2 Organizing Quantitative Data 2.3 Additional Displays 2.4 Misrepresentations of Data September 10, 2008 Categorical Variables

E N D
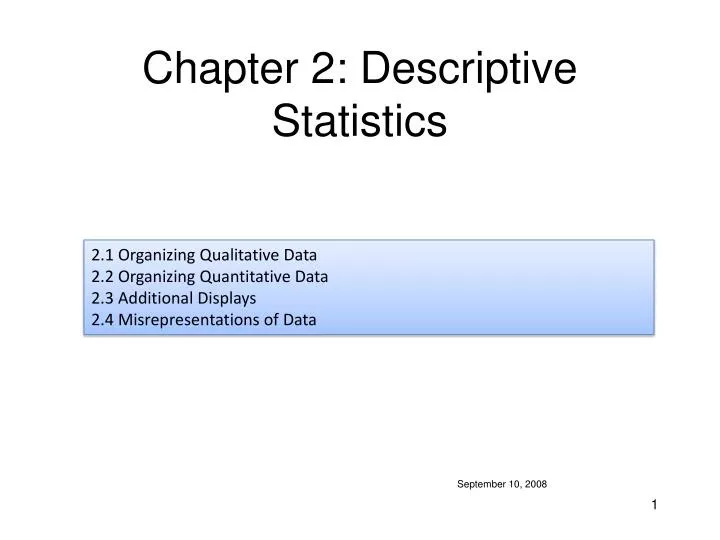
Chapter 2: Descriptive Statistics 2.1 Organizing Qualitative Data 2.2 Organizing Quantitative Data 2.3 Additional Displays 2.4 Misrepresentations of Data September 10, 2008
Categorical Variables • Each observation (data point) for a categorical variable belongs to one category among different categories • Variable: • Gender (Categories: male or female) • Religious Affiliation (Protestant, Catholic, Jew, Muslim, etc.) • Home State or Country (NJ, AR, CA, FL, Canada, etc.) • Favorite Singer (Elvis, Sting, Sinatra, etc.) • Eye Color (brown, green, blue, hazel, black) • Favorite Type of Music (jazz, country, rock, etc.) Section 2.1
Frequency Tables for Categorical Data Definition: For a population or a sample and a particular categorical variable, the number of times that the variables is in a particular category is called the frequency of this category. The category that has the highest frequency is called the mode for the variable. A table composed of the frequencies for the categories is sometimes called the frequencydistribution or simply distribution of the categorical variable. Remark: It makes sense to construct frequency tables for a discrete quantitative variable since we can consider each discrete value of the variable a category.
Relative Frequency Example: The categorical variable is the color of a ball in a population. A sample of 10 red, green and blue balls
Example Consider the population of vehicles that are parked in the 25th Avenue Garage and consider the categorical variable for the type of transmission (automatic or manual) in the vehicles. One hundred cars were surveyed. We construct a frequencytable. The frequency of automatics is 73 and the frequency of manuals is 27. The mode for the categorical variable and sample is 73. The relative frequency of automatics is 73/100 = 0.73 (73%).
Remarks on Frequency Tables • A method of organizing data • Lists of all possible categories for a variable along with the number of observations for each value of the variable. • In addition, we sometimes add columns for the proportion and percentage for each value of the variable.
Example (categorical) We are interested in the dominant color of cars that are parked on the Vanderbilt campus. Suppose we go the 25th Avenue Garage and survey the color (black, white, red, blue, green, other) of 100 cars for a sample. In the table below we summarize the counts of this categorical variable.
Bar Chart Definition: A bar chart for a categorical variable is series of horizontal or vertical bars with the height of each bar representing the frequency of a particular category for the variable. Bar charts can also be constructed using Excel.
Bar Chart for Relative Frequency Remark: Instead of the bars representing the frequency of a category, they could represent the relative frequency.
Pie Chart Definition: A pie chart for a categorical variable is a circle divided into sectors with each sector representing the frequency of a category for the variable.
Pie Chart with Excel Create a pie chart for the following data using Excel.
Example (Doctorates) Doctorate Recipients: 1983, 1993, 2003. For each year we have six categories: type of degree.
(continued) Green - 1983 Red - 1993 Orange - 2003
Pareto Charts Definition: A ParetoChart is a bar graph whose bars are drawn in decreasing order of frequency or relative frequency. In a bar chart, if we order the bars (categories) from tallest to smallest, then this bar chart is called a Pareto Chart. The reason for doing this is that the “most important” category appears first.
Example Consider the following sample composed of Vanderbilt students who are studying at least one foreign language. Construct the frequency distribution for this sample. Construct the relative frequency distribution. Construct the bar chart for the frequency. Construct the bar chart for the relative frequency. What is the mode of the frequency distribution?
Organizing Quantitative Data • Two Types of Quantitative Data • Discrete • Tables • Frequency Tables • Relative Frequency Tables • Dot Plots • Stem-and-Leaf Plots • Histograms • Continuous • Histograms Section 2.1
Tables and Discrete Data Remark: There is essentially no difference between categorical data and discrete quantitative data. Each number represents a category. Example: Consider a discrete set of quantitative data: {1,-1,1,0,0,2,3,1,0,2} . We can construct a frequency table for the numbers in this set of numbers.
Histograms Definition: A histogram is a special type of bar chart that shows the frequency of quantitative data that is separated into intervals (bins or classes).
Example Construct a histogram for the data, {1.1,1.8, 0.9, 0.2, 2.5, 1.3 ,2.1, 2.1, 2.9, 2.0}, using the bins: [0,1), [1,2), [2,3). [0,1): 0.9, 0.2 (frequency = 2) [1,2): 1.1, 1.8, 1.3 (frequency = 3) [2,3): 2.5, 2.1, 2.1, 2.9, 2.0 (frequency = 5)
Dot Plots Definition: A dotplot is a chart for discrete quantitative data where each observation is represented by a dot where the possible values of data is represented along the horizontal axis. • Primarily for discrete quantitative data • Similar to a bar chart or histogram • Includes information about frequency i.e., how many times a data point appears as a single number or in a range of values.
Example (quantitative) Suppose we stand at the entrance of the Math. Building and count the number of people entering over a 10 minute period in 1 minute increments. Below we have a table that summarizes our sample and the resulting dot plot. In the table, we didn’t put intervals during which no people entered.
Example This table summarizes the about of sodium (mg) and sugar (g) for some popular breakfast cereals. It also characterizes the type (adult or child) of cereal. Hence, we have three pieces of data (variables) for each cereal: 2 quantitative and 1 categorical. We will use the dot plot for the sodium.
Dot Plot of Sodium Notice that the a dot plot gives information about the frequency that a number in a numerical data sample reoccurs, e.g., 70 occurs once and 200 twice.
Stem-and-Leaf Plots • A stem-and-leaf plot organizes data to show its shape and distribution. • Each data point is represented by a stem and a leaf. • Usually, the leaf is the last digit of the numerical data point and the other digits totheleftoftheleaf form the stem. For example, if 9834 is a data point, then 4 is the leaf and 983 is the stem. (stemleaf) • In a set of data, a stem may have several leaves. • For one digit data (0,1,2,…,9), we can represent the data as 00,01,…09. For a data point 0X, the leaf is X and stem is 0. • We usually organize by stems. • It is sometimes to modify this representation when large numbers are involved. In this case the stem will represent a class of numbers of the form: d x 10s.
Example Suppose a sample contains the following data points: {9, 15, 17, 24, 50, 65, 101, 170, 171}.
Example Construct a Stem-and-Leaf plot for the data: {5.4, 4.3, 4.1, 8.6, 6.0, 7.9, 9.1, 6.1, 3.1,14.5, 12.5, 8.3, 10.1, 8.2, 6.8, 10.9, 2.3, 1.0, 8.3, 8.9, 6.1, 6.5, 6.0, 9.4, 0.1, 13.9, 3.7, 10.1, 9.9, 4.9, 6.4, 10.3, 2.3. 11.9, 11.7, 12.1, 9.8, 7.8, 2.9, 6.7}. We ignore the the decimal point or alternatively multiple each number by 10.
On-line Stem-and-Leaf Plotter http://www.shodor.http://www.shodor.org/interactivate/activities/StemAndLeafPlotter/
Stem-and-leaf Plots and Frequency Consider a sample {101,103,104,108,109}. If we constructed the stem-and-leaf plot for this data, then there is a single stem (10) and five leaves (1,3,4,8,9). Hence, the number of leaves i.e., 5, the frequency that the data appears in the interval [100,109]. Hence, we can conclude that there is a connection in the number of leaves and the number of times data fall in 10 integer length intervals.
Bottom Line Dot plots and stem-and-leaf plots segregate the data into bins (or numerical ranges or classes) and they show the frequency of data within those classes. This is useful information, but it is not practical when one has a sample with a large number of data points.
Remark: Frequency Tables & Dot Plots A frequency table and a dot plot give basically the same information. Sodium Data: 000 210 260 125 220 290 210 140 220 200 125 170 250 150 170 70 230 200 290 180 The frequency of a sodium interval level can be gotten from the dot plot.
Continuous Data described by Histograms Definition: A histogram is a type of bar chart that gives the frequencies or relative frequencies of occurrences of a quantitative variable (either discrete or continuous) in specified intervals.
Construction of Histograms • Define intervals of equal width for the variable under consideration. For example if our data in our sample are integers and ranges from 0 to 50, we might choose the intervals (bins) [0,9],[10,19],[20,29],[30,39],[40,49,[50,60]. The intervals or bins are called classes. The length of a class is called the classwidth. • Count the number of data points are in each bin. In the above example, we would calculate 6 nonnegative integer values. • Construct a bar chart with the intervals specifying the width of the bars and the frequencies giving the height of the bars. Note that the width of the bar is arbitrary as long as we know the length of the intervals over which we do the frequency counting. • The heights of the bars in the histogram are called the distribution of the sample. • Histograms could be used for categorical data. • Remark: Instead of using the frequency counts, we could use the fraction of the total sample size (percentage) as the height.
Example Construct a histogram (using percentages) for the following sample: {1.1, -1.0, 2.1, 3.5, -2.1, 0.9, 0.75, -0.5, 0.25, 4.5, 4.1}.
(continued) How many students were sampled? What is the width of the intervals? Which range of IQ had the highest frequency? Which range of IQ had the lowest frequency?
Dot, Stem-and-leaf, or Histogram? • Dot plot and Stem-and-Leaf plot: • Useful for showing information about small data sets. • Shows actual data. • Histogram • Useful for showing information about large data sets. • Can be used for continuous or discrete data. • Most compact plot. • Has flexibility in defining intervals.
The Shape of the Distribution For a histogram, we can associate the graph of a function by drawing a smooth curve through the midpoints of each bar. The shape of this curve can be used to describe the shape of the histogram.
Unimodal and Bimodal Unimodal: one hump Bimodal: two humps
Skewed Distributions Skewed to the right Skewed to the left Symmetric
Distribution Terminology • The value of the highest bar in a histogram is called the mode of the distribution. Hence, the terminology unimodal and bimodal. • A distribution is said to be symmetric in there is a vertical line that separates the distribution into identical pieces. • A distribution that is not symmetric is said to be skewed. • The “ends” of a distribution are called the tails of the distribution.
Outliers A bar that is completely separated from the cluster of bars is called an outlier.
Wechsler Adult Intelligence Scale (IQ) The distribution is almost symmetric.
Additional Displays for Quantitative Data Alternative to histograms for quantitative data: Frequency Polygons. Definition: Suppose that an interval, [a,b), represents a class for a set of quantitative data. The classmidpoint is defined as (a+b)/2. Definition: A frequency polygon is a graph that is constructed from the class midpoints and their frequencies. Section 2.3
Example Mathematica Demonstration