Download
1 / 10
100 likes | 126 Views
<br>Aquafeed Market Size By Application, Product, Competitive Analysis & Forecast Till 2022<br>

E N D
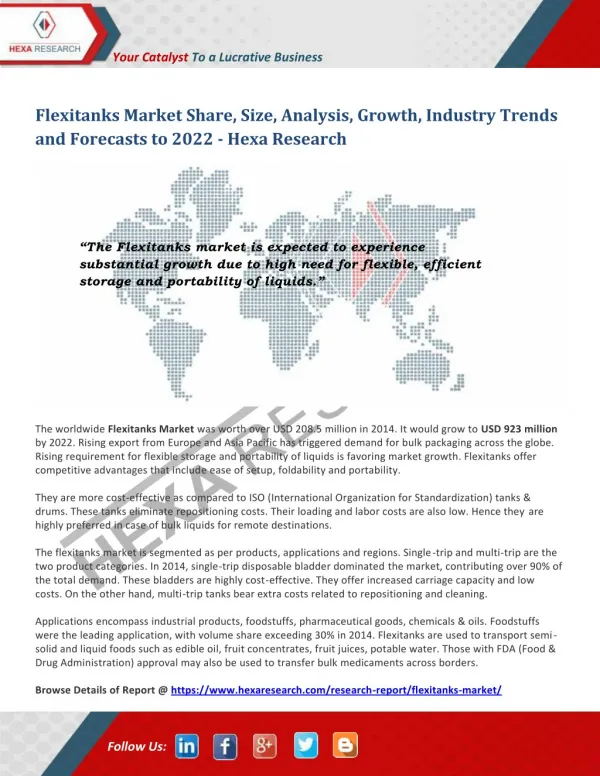
Your Catalyst To a Lucrative Business Aquafeed Market Size, Share, Growth, Industry Analysis, Trends and Forecast Report up to 2022 | Hexa Research “Global Aquafeed Market size is expected to reach 96.3 million tons by 2022, growing at a CAGR of 11.1% from 2015 to 2022. Global aquafeed additives market size is likely to be worth USD 1.2 billion by 2022.” Global Aquafeed Market size is anticipated to be valued at USD 165.04 billion by 2022, as per a new research report by HexaResearch. Increase in fish consumption for direct and indirect consumer applications is anticipated to drive the market growth. Increasing awareness regarding feed benefits in aquaculture among breeders is likely to drive the demand. Rising nutraceuticals demand such as omega 3 fortified products is expected to drive industry growth. Global aquafeed additives market is expected to reach USD 1.21 billion by 2022. Amino acids dominated aquaculture additives market and accounted for more than 25% of the total demand in 2014. Increasing demand to maintain proper metabolism and provide proteins to aquatic animals is likely to drive growth. Feed acidifiers are likely to witness highest gains with an estimated CAGR of 6.0% from 2015 to 2022. Feed acidifiers demand has been witnessing a growth as it is effective in controlling diseases including caused by harmful bacteria such as E coli and Salmonella. Browse Details of Report@ https://www.hexaresearch.com/research-report/aquafeed-market/ Follow Us:
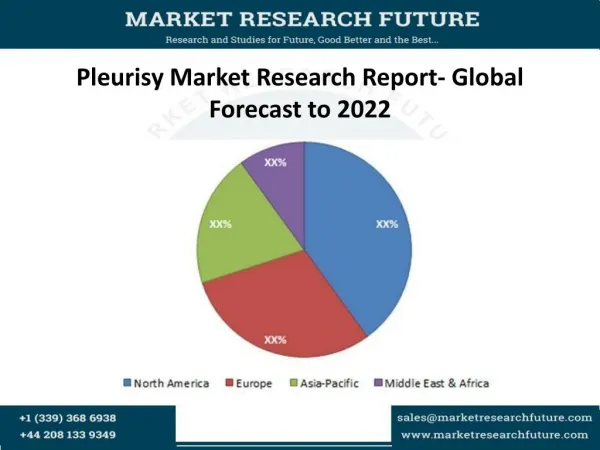
Your Catalyst To a Lucrative Business Key report insights suggest: Global aquafeed market size was estimated at 41.62 million tons in 2013 and may reach 96.27 million tons by 2022 growing with an estimated CAGR of 11.1% from 2015 to 2022. Carps were the dominant end-use consumers in aquafeed industry and accounted for 28.6% of the total demand in 2014. Carps are rich source of omega-3 fatty acids which prove to be beneficial in food & beverage industry to reduce cholesterol level among consumers. Molluscs are likely to witness higher gains with an estimated CAGR of 11.3% from 2015 to 2022 Asia Pacific dominated the regional aquafeed market and accounted for 65.2% of the total volume in 2014 and likely to witness highest growth rates. Predominant aquaculture industry coupled with government preference to boost aquafeed demand particularly in China, Thailand and India is likely to drive regional growth. Europe is expected to witness above average growth rates of 11.2% from 2015 to 2022. Europe aquafeed additives market is estimated to reach USD 200.9 million by 2022, with feed acidifiers anticipated to witness maximum gains. Aquafeed industry is fragmented with different companies having variety of products. Prominent companies involved in this market are Dibaq Aquaculture, Addcon Group GmbH, Biomar, Ridley and Altech, Inc. For the purpose of this study, HexaResearch has segmented the aquafeed and aquaculture additives market on the basis of product, application and region: Global Aquafeed Application Overview (Volume, Kilo Tons; Revenue, USD Million, 2012 – 2022) Crustaceans Mollusks Carp salmon Catfish Tilapia Others Follow Us:
Your Catalyst To a Lucrative Business Global Aquafeed Regional Overview (Volume, Kilo Tons; Revenue, USD Million, 2012 – 2022) North America Europe Asia Pacific RoW Global Aquaculture Additives Product Overview (Revenue, USD Million, 2012 – 2022) Amino Acids Antibiotics Vitamins Feed Acidifiers Others Global Aquaculture Additives Regional Overview (Revenue, USD Million, 2012 – 2022) North America Europe Asia Pacific RoW Browse Related Category Market Reports @ https://www.hexaresearch.com/research-category/food-and-beverages-industry Follow Us:
Your Catalyst To a Lucrative Business Table of Content of Aquafeed Market Chapter 1 Executive Summary Chapter 2 Aquafeed Industry Overview 2.1 Market segmentation 2.2 Aquafeed market size and growth prospects, 2012 - 2022 2.3 Aquafeed value chain analysis 2.4 Aquafeed market dynamics 2.4.1 Market driver analysis 2.4.1.1 Increasing direct human consumption (DHC) of fish and fish products 2.4.1.2 Growing aquaculture market 2.4.2 Market restraints analysis 2.4.2.1 Volatile raw material prices 2.5 Key opportunities prioritized 2.5.1 Key opportunities prioritized – Aquafeed 2.5.2 Key opportunities prioritized – Aquaculture additives 2.6 Industry analysis - Porter’s 2.7 Aquafeed PESTEL analysis Chapter 3 Aquaculture Additives Product Overview 3.1 Global aquaculture additive market revenue share by product, 2014 & 2022 3.2 Amino acids 3.2.1 Global amino acid demand as an aquafeed additive, 2012-2022, (USD Million) 3.2.2 Global amino acid demand as an aquafeed additive, by region, 2012-2022, (USD Million) 3.3 Antibiotics 3.3.1 Global antibiotics demand as an aquafeed additive, 2012-2022, (USD Million) 3.3.2 Global antibiotics demand as an aquafeed additive, by region, 2012-2022, (USD Million) 3.4 Vitamins 3.4.1 Global vitamins demand as an aquafeed additive, 2012-2022, (USD Million) 3.4.2 Global vitamins demand as an aquafeed additive, by region, 2012-2022, (USD Million) 3.5 Feed Acidifiers 3.5.1 Global feed acidifiers demand as an aquafeed additive, 2012-2022, (USD Million) Follow Us:
Your Catalyst To a Lucrative Business 3.5.2 Global feed acidifiers demand as an aquafeed additive, by region, 2012-2022, (USD Million) 3.6 Others 3.6.1 Global demand for other aquafeed additives, 2012-2022, (USD Million) 3.6.2 Global demand for other aquafeed additives, by region, 2012-2022, (USD Million) Chapter 4 Aquafeed Application Overview 4.1 Global aquafeed market volume share by application, 2014 & 2022 4.2 Carp 4.2.1 Market estimates and forecast in carp, 2012-2022, (Kilo Tons) (USD Million) 4.2.2 Market estimates and forecast in carp, by region, 2012-2022, (Kilo Tons) (USD Million) 4.3 Mollusks 4.3.1 Market estimates and forecast in mollusks, 2012-2022, (Kilo Tons) (USD Million) 4.3.2 Market estimates and forecast in mollusks, by region, 2012-2022, (Kilo Tons) (USD Million) 4.4 Salmon 4.4.1 Market estimates and forecast in salmon, 2012-2022, (Kilo Tons) (USD Million) 4.4.2 Market estimates and forecast in salmon, by region, 2012-2022, (Kilo Tons) (USD Million) 4.5 Crustaceans 4.5.1 Market estimates and forecast in crustaceans, 2012-2022, (Kilo Tons) (USD Million) 4.5.2 Market estimates and forecast in crustaceans, by region, 2012-2022, (Kilo Tons) (USD Million) 4.6 Tilapia 4.6.1 Market estimates and forecast in tilapia, 2012-2022, (Kilo Tons) (USD Million) 4.6.2 Market estimates and forecast in tilapia, by region, 2012-2022, (Kilo Tons) (USD Million) 4.7 Cat Fish 4.7.1 Market estimates and forecast in cat fish, 2012-2022, (Kilo Tons) (USD Million) 4.7.2 Market estimates and forecast in cat fish, by region, 2012-2022, (Kilo Tons) (USD Million) 4.8 Others 4.8.1 Market estimates and forecast in other species, 2012-2022, (Kilo Tons) (USD Million) 4.8.2 Market estimates and forecast in other species, by region, 2012-2022, (Kilo Tons) (USD Million) Chapter 5 Aquafeed Regional Overview 5.1 Global aquafeed market volume by region, 2014 & 2022 5.2 North America 5.2.1 Market estimates and forecast, 2012-2022, (Kilo Tons) (USD Million) Follow Us:
Your Catalyst To a Lucrative Business 5.2.2 Market estimates and forecast, by product, 2012 – 2022, (USD Million) 5.2.3 Market estimates and forecast, by application, 2012 – 2022, (Kilo Tons) (USD Million) 5.3 Europe 5.3.1 Market estimates and forecast, 2012-2022, (Kilo Tons) (USD Million) 5.3.2 Market estimates and forecast, by product, 2012 – 2022, (USD Million) 5.3.3 Market estimates and forecast, by application, 2012 – 2022, (Kilo Tons) (USD Million) 5.4 Asia Pacific 5.4.1 Market estimates and forecast, 2012-2022, (Kilo Tons) (USD Million) 5.4.2 Market estimates and forecast, by product, 2012 – 2020, (USD Million) 5.4.3 Market estimates and forecast, by application, 2012 – 2022, (Kilo Tons) (USD Million) 5.5 RoW 5.5.1 Market estimates and forecast, 2012-2022, (Kilo Tons) (USD Million) 5.5.2 Market estimates and forecast, by product, 2012 – 2022, (USD Million) 5.5.3 Market estimates and forecast, by application, 2012 – 2022, (Kilo Tons) (USD Million) Chapter 6 Competitive Landscape 6.1 Alltech Inc. 6.1.1 Company Overview 6.1.2 Financial Performance 6.1.3 Product Benchmarking 6.1.4 Strategic Initiatives 6.2 Biomar A/S 6.2.1 Company Overview 6.2.2 Financial Performance 6.2.3 Product Benchmarking 6.2.4 Strategic Initiatives 6.3 Cargill Inc. 6.3.1 Company Overview 6.3.2 Financial Performance 6.3.3 Product Benchmarking 6.3.4 Strategic Initiatives 6.4 Ridley Corporation 6.4.1 Company Overview 6.4.2 Financial Performance Follow Us:
Your Catalyst To a Lucrative Business 6.4.3 Product Benchmarking 6.4.4 Strategic Initiatives 6.5 Norel Animal Nutrition 6.5.1 Company Overview 6.5.2 Financial Performance 6.5.3 Product Benchmarking 6.5.4 Strategic Initiatives 6.6 Aller Aqua A/S 6.6.1 Company Overview 6.6.2 Financial Performance 6.6.3 Product Benchmarking 6.6.4 Strategic Initiatives 6.7 Beneo GmbH 6.7.1 Company Overview 6.7.2 Financial Performance 6.7.3 Product Benchmarking 6.8 Cermaq ASA 6.8.1 Company Overview 6.8.2 Financial Performance 6.8.3 Product Benchmarking 6.8.4 Strategic Initiatives 6.9 Dibaq a.s. 6.9.1 Company Overview 6.9.2 Financial Performance 6.9.3 Product Benchmarking 6.10 Addcon Group GmbH 6.10.1 Company Overview 6.10.2 Financial Performance 6.10.3 Product Benchmarking 6.10.4 Strategic Initiatives 6.11 Archer Daniel Midland (ADM) 6.11.1 Company Overview 6.11.2 Financial Performance 6.11.3 Product Benchmarking 6.11.4 Strategic Initiatives 6.12 BASF SE Follow Us:
Your Catalyst To a Lucrative Business 6.12.1 Company Overview 6.12.2 Financial Performance 6.12.3 Product Benchmarking 6.12.4 Strategic Initiatives 6.13 Biomin Holding GmBH 6.13.1 Company Overview 6.13.2 Financial Performance 6.13.3 Product Benchmarking 6.13.4 Strategic Initiatives 6.14 Skretting 6.14.1 Company Overview 6.14.2 Financial Performance 6.14.3 Product Benchmarking 6.14.4 Strategic Initiatives 6.15 DSM 6.15.1 Company Overview 6.15.2 Financial Performance 6.15.3 Product Benchmarking 6.15.4 Strategic Initiatives 6.16 Evonik Industries 6.16.1 Company Overview 6.16.2 Financial Performance 6.16.3 Product Benchmarking 6.16.4 Strategic Initiatives 6.17 InVivo NSA 6.17.1 Company Overview 6.17.2 Financial Performance 6.17.3 Product Benchmarking 6.17.4 Strategic Initiatives 6.18 Novus International Inc. 6.18.1 Company Overview 6.18.2 Financial Performance 6.18.3 Product Benchmarking 6.18.4 Strategic Initiatives 6.19 De Heus 6.19.1 Company Overview Follow Us:
Your Catalyst To a Lucrative Business 6.19.2 Financial Performance 6.19.3 Product Benchmarking 6.19.4 Strategic Initiatives 6.20 Nutriad International 6.20.1 Company Overview 6.20.2 Financial Performance 6.20.3 Product Benchmarking 6.20.4 Strategic Initiatives 6.21 Avanti Feeds Ltd. 6.21.1 Company Overview 6.21.2 Financial Performance 6.21.3 Product Benchmarking 6.21.4 Strategic Initiatives 6.22 NK Ingredients Pte Ltd. 6.22.1 Company Overview 6.22.2 Financial Performance 6.22.3 Product Benchmarking 6.23 EWOS 6.23.1 Company Overview 6.23.2 Financial Performance 6.23.3 Product Benchmarking 6.23.4 Strategic Initiatives Chapter 7 Research Methodology 7.1 Research Methodology 7.2 Research Scope & Assumptions 7.3 List of Data Sources Follow Us:
Your Catalyst To a Lucrative Business About Us: Hexa Research is a market research and consulting organization, offering industry reports, custom research and consulting services to a host of key industries across the globe. We offer comprehensive business intelligence in the form of industry reports which help our clients obtain clarity about their business environment and enable them to undertake strategic growth initiatives. Contact Us: Ryan Shaw Hexa Research Felton Office Plaza 6265 Highway 9 Felton, California 95018 United States Phone: +1-800-489-3075 Email: sales@hexaresearch.com Website - http://www.hexaresearch.com/ Follow Us: