Download
1 / 8
80 likes | 90 Views
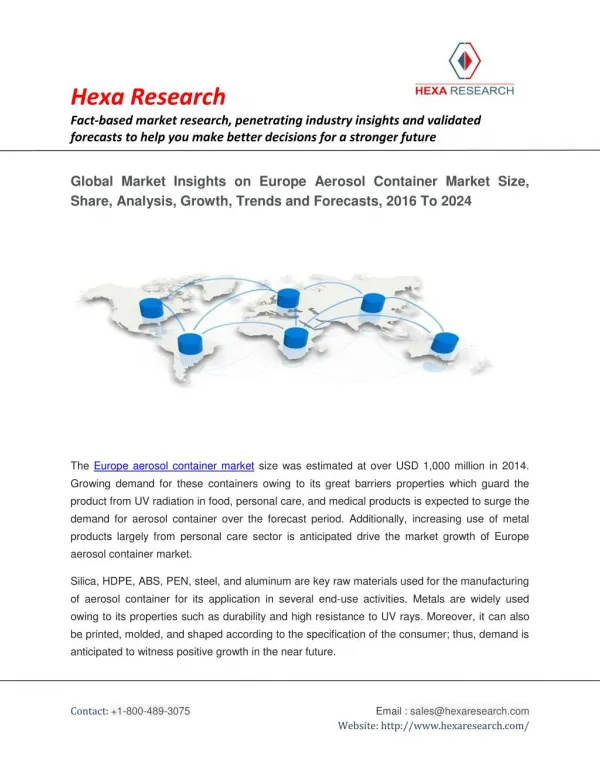
The Europe aerosol container market size was estimated at over USD 1,000 million in 2014. Growing demand for these containers owing to its great barriers properties which guard the product from UV radiation in food, personal care, and medical products is expected to surge the demand for aerosol container over the forecast period.

E N D
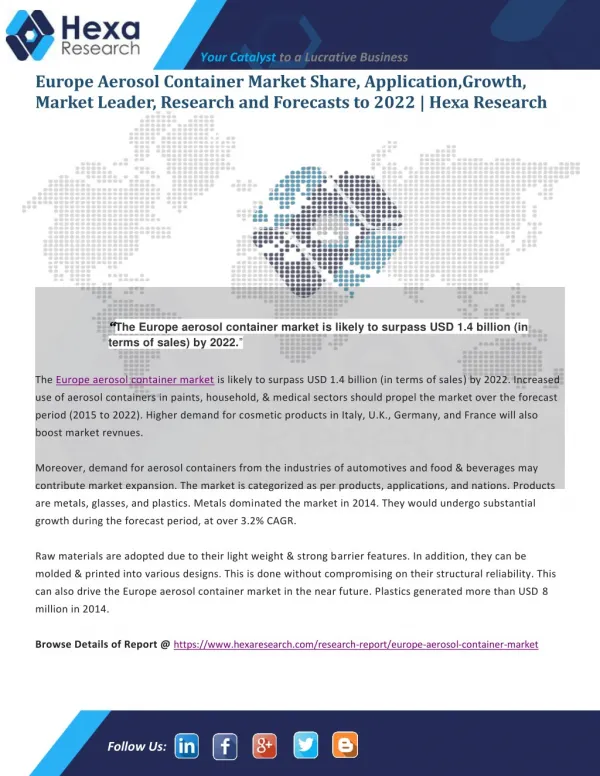
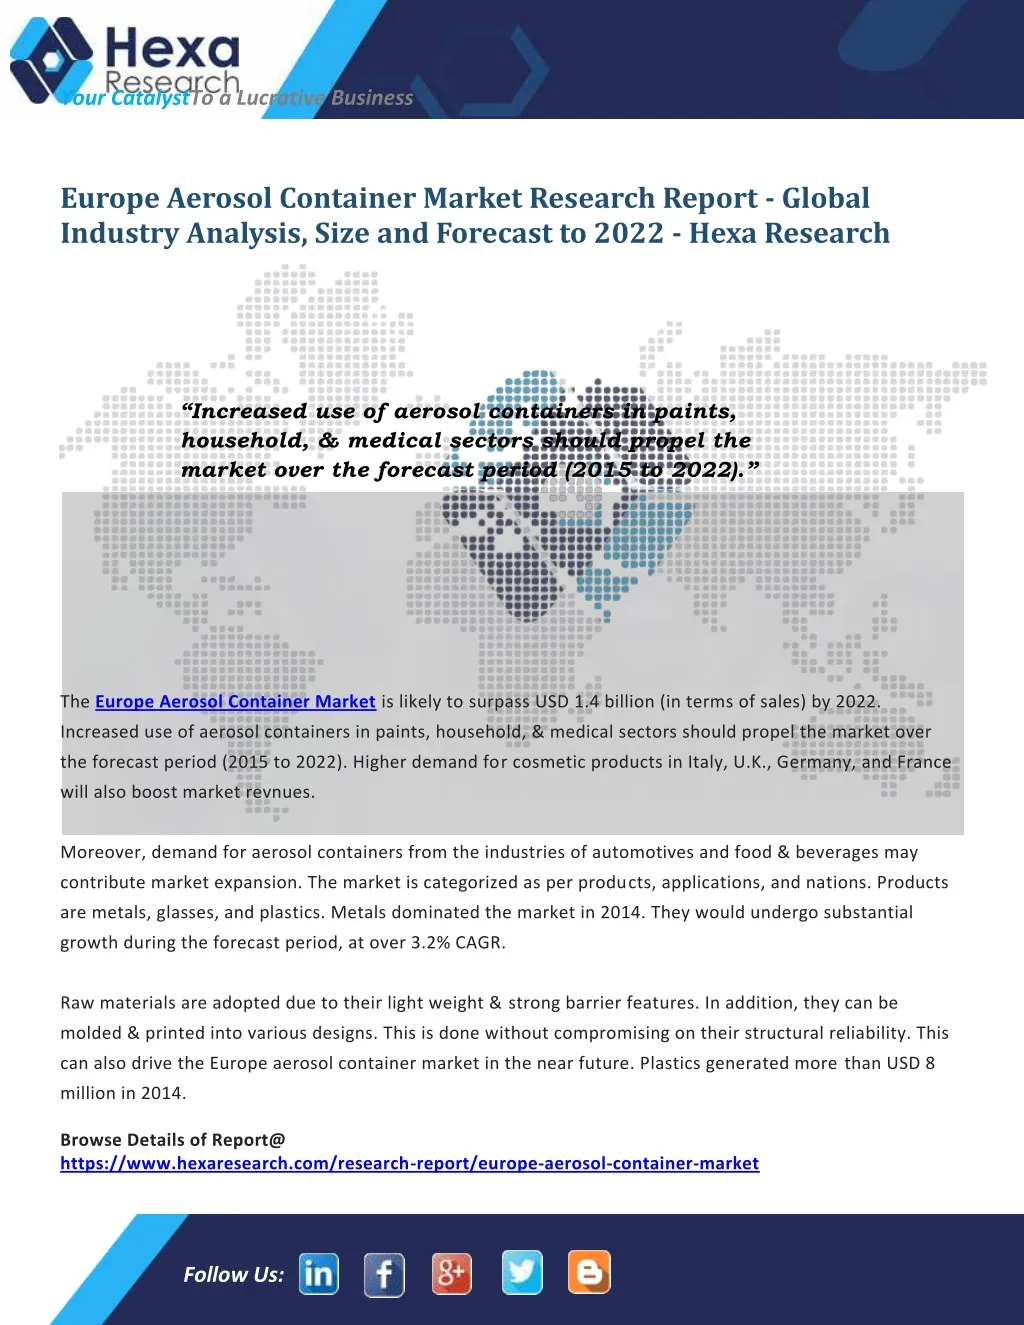
Your CatalystTo a Lucrative Business Europe Aerosol Container Market Research Report - Global Industry Analysis, Size and Forecast to 2022 - Hexa Research “Increased use of aerosol containers in paints, household, & medical sectors should propel the market over the forecast period (2015 to 2022).” The Europe Aerosol Container Market is likely to surpass USD 1.4 billion (in terms of sales) by 2022. Increased use of aerosol containers in paints, household, & medical sectors should propel the market over the forecast period (2015 to 2022). Higher demand for cosmetic products in Italy, U.K., Germany, and France will also boost market revnues. Moreover, demand for aerosol containers from the industries of automotives and food & beverages may contribute market expansion. The market is categorized as per products, applications, and nations. Products are metals, glasses, and plastics. Metals dominated the market in 2014. They would undergo substantial growth during the forecast period, at over 3.2% CAGR. Raw materials are adopted due to their light weight & strong barrier features. In addition, they can be molded & printed into various designs. This is done without compromising on their structural reliability. This can also drive the Europe aerosol container market in the near future. Plastics generated more than USD 8 million in 2014. Browse Details of Report@ https://www.hexaresearch.com/research-report/europe-aerosol-container-market Follow Us:
Your CatalystTo a Lucrative Business Applications include household, personal care, medical, paints, and others. Personal care dominated the market in 2014, producing over USD 500 million. Greater usage of aerosol containers for making body sprays, antiperspirants, hair sprays, & after shaves is expected to add market demand till 2022. Medical will experience the fastest expansion in the seven years ahead. It would rise at over 5% CAGR during the same period. Wider aerosol adoption across pressurized metered-dose inhalers for asthma can propel medical applications. Nations-wise, U.K. was the biggest market manufacturer in 2014. This country contributed over 25% of the total volumes the same year. National awareness regarding the advantages of aerosol containers is projected to drive U.K.’s production volumes from 2015 to 2022. Demand from Germany stood over USD 200 million in 2014. It should observe a significant boost over the forecast period. Germany’s huge FMCG firms would positively affect national growth in the near future. France held over 12% shares (regarding volumes) in 2014. Demand for paints across multiple applications, specifically construction, could propel the France market. Key companies operating in the Europe aerosol container market encompass Ball Corporation, Plastipak Holdings, Arnest Group, and TUBEX Holding GmbH. Browse Related Category Market Reports@ https://www.hexaresearch.com/research-category/advanced-interior-materials Table of Content of Europe Aerosol Container Market Follow Us:
Your CatalystTo a Lucrative Business Chapter 1 Research Methodology 1.1 Research Methodology 1.2 Research Scope & Assumptions 1.3 List of Data Sources Chapter 2 Executive Summary Chapter 3 Europe Aerosol Container Industry Outlook 3.1 Europe aerosol container market segmentation 3.2 Europe aerosol container market size and growth prospects, 2012 - 2022 3.3 Europe aerosol container value chain analysis 3.3.1 Vendor landscape 3.4 Raw material outlook 3.4.1 Aluminum 3.4.2 Steel 3.4.3 Polyethylene Naphthalate (PEN) 3.4.4 Acrylonitrile Butadiene Styrene (ABS) 3.4.5 High Density Polyethylene (HDPE) 3.4.6 Silica 3.5 Technology Overview 3.5.1 Aerosol container technology 3.5.1.1 Two-piece and three-piece laminated steel aerosol container technology 3.6 Regulatory framework 3.7 Europe aerosol container market dynamics 3.7.1 Market driver analysis 3.7.1.1 Increasing demand for aerosol products in personal care and household application 3.7.1.2 Technological innovation 3.7.2 Market restraint analysis 3.7.2.1 Stringent regulatory scenario 3.8 Europe aerosol container – Key opportunities prioritized 3.9 Europe aerosol container Porter’s analysis 3.10 Europe aerosol container competitive scenario, 2014 3.11 Europe aerosol container PESTEL analysis Chapter 4 Europe Aerosol Container Product Outlook Follow Us:
Your CatalystTo a Lucrative Business 4.1 Europe aerosol container market volume share by product, 2014 & 2022 4.2 Metal 4.2.1 Europe metal aerosol container demand estimates and forecast, 2014 To 2022, (Million units) (USD million) 4.3 Glass 4.3.1 Europe glass aerosol container demand estimates and forecast, 2014 To 2022, (Million units) (USD million) 4.4 Plastic 4.4.1 Europe plastic aerosol container demand estimates and forecast, 2014 To 2022, (Million units) (USD million) Chapter 5 Europe Aerosol Container Country Outlook 5.1 Europe aerosol container production, by country, 2014 & 2022 5.2 Greece 5.2.1 Greece aerosol container production and forecast, 2014 To 2022, (Thousand units) (USD thousand) 5.2.2 Greece aerosol container production and forecast, by product, 2014 - 2022, (Thousand units) (USD thousand) 5.2.3 Greece metal aerosol container production and forecast, by application, 2014 - 2022, (Thousand units) (USD thousand) 5.3 Italy 5.3.1 Italy aerosol container production and forecast, 2014 To 2022, (Million units) (USD Million) 5.3.2 Italy aerosol container production and forecast, by product, 2014 - 2022, (Million units) (USD million) 5.3.3 Italy metal aerosol container production and forecast, by application, 2014 - 2022, (Million units) (USD million) 5.4 Portugal 5.4.1 Portugal aerosol container production and forecast, 2014 To 2022, (Million units) (USD million) 5.4.2 Portugal aerosol container production and forecast, by product, 2014 - 2022, (Million units) (USD million) 5.4.3 Portugal metal aerosol container production and forecast, by application, 2014 - 2022, (Million units) (USD million) 5.5 Spain 5.5.1 Spain aerosol container production and forecast, 2014 To 2022, (Million units) (USD million) 5.5.2 Spain aerosol container production and forecast, by product, 2014 - 2022, (Million units) (USD million) Follow Us:
Your CatalystTo a Lucrative Business 5.5.3 Spain metal aerosol container production and forecast, by application, 2014 - 2022, (Million units) (USD million) 5.6 France 5.6.1 France aerosol container production and forecast, 2014 To 2022, (Million units) (USD million) 5.6.2 France aerosol container production and forecast, by product, 2014 - 2022, (Million units) (USD million) 5.6.3 France metal aerosol container production and forecast, by application, 2014 - 2022, (Million units) (USD million) 5.6.4 France glass aerosol container production and forecast, by application, 2014 - 2022, (Million units) (USD million) 5.7 Belgium 5.7.1 Belgium aerosol container production and forecast, 2014 To 2022, (Million units) (USD million) 5.7.2 Belgium aerosol container production and forecast, by product, 2014 - 2022, (Million units) (USD million) 5.7.3 Belgium metal aerosol container production and forecast, by application, 2014 - 2022, (Million units) (USD million) 5.8 Germany 5.8.1 Germany aerosol container production and forecast, 2014 To 2022, (Million units) (USD million) 5.8.2 Germany aerosol container production and forecast, by product, 2014 - 2022, (Million units) (USD million) 5.8.3 Germany metal aerosol container production and forecast, by application, 2014 - 2022, (Million units) (USD million) 5.9 United Kingdom 5.9.1 UK aerosol container production and forecast, 2014 To 2022, (Million units) (USD million) 5.9.2 UK aerosol container production and forecast, by product, 2014 - 2022, (Million units) (USD million) 5.9.3 UK metal aerosol container production and forecast, by application, 2014 - 2022, (Million units) (USD million) 5.9.4 UK plastic aerosol container production and forecast, by application, 2014 - 2022, (Million units) (USD million) 5.10 Netherlands 5.10.1 Netherlands aerosol container production and forecast, 2014 To 2022, (Million units) (USD million) 5.10.2 Netherlands aerosol container production and forecast, by product, 2014 - 2022, (Million units) (USD million) 5.10.3 Netherlands metal aerosol container production and forecast, by application, 2014 - 2022, (Million units) (USD million) Follow Us:
Your CatalystTo a Lucrative Business 5.10.4 Netherlands glass aerosol container production and forecast, by application, 2014 - 2022, (Thousand units) (USD thousand) 5.11 Rest of Europe 5.11.1 RoEU aerosol container production and forecast, 2014 To 2022, (Million units) (USD million) 5.11.2 RoEU aerosol container production and forecast, by product, 2014 - 2022, (Million units) (USD million) 5.11.3 RoEU metal aerosol container production and forecast, by application, 2014 - 2022, (Million units) (USD million) Chapter 6 Competitive Landscape 6.1 Ardagh Group S.A. 6.1.1 Company Overview 6.1.2 Financial Performance 6.1.3 Product Benchmarking 6.1.4 Strategic Initiatives 6.2 TUBEX Holding GmbH 6.2.1 Company Overview 6.2.2 Financial Performance 6.2.3 Product Benchmarking 6.3 Nussbaum Matzingen AG 6.3.1 Company Overview 6.3.2 Financial Performance 6.3.3 Product Benchmarking 6.4 Perfektup Amb.San.ve Tic.A.S. 6.4.1 Company Overview 6.4.2 Financial Performance 6.4.3 Product Benchmarking 6.5 Ball Corporation 6.5.1 Company Overview 6.5.2 Financial Performance 6.5.3 Product Benchmarking 6.5.4 Strategic Initiatives 6.6 Redalluminio snc di Redaelli P. e C. 6.6.1 Company Overview 6.6.2 Financial Performance 6.6.3 Product Benchmarking Follow Us:
Your CatalystTo a Lucrative Business 6.7 Plastipak Holdings, Inc. 6.7.1 Company Overview 6.7.2 Financial Performance 6.7.3 Product Benchmarking 6.7.4 Strategic Initiatives 6.8 Crown Holdings Inc. 6.8.1 Company Overview 6.8.2 Financial Performance 6.8.3 Product Benchmarking 6.8.4 Strategic Initiatives 6.9 Alltub Italia S.R.L. 6.9.1 Company Overview 6.9.2 Financial Performance 6.9.3 Product Benchmarking 6.10 Arnest Group 6.10.1 Company Overview 6.10.2 Financial Performance 6.10.3 Product Benchmarking Follow Us:
Your CatalystTo a Lucrative Business About Us: Hexa Research is a market research and consulting organization, offering industry reports, custom research and consulting services to a host of key industries across the globe. We offer comprehensive business intelligence in the form of industry reports which help our clients obtain clarity about their business environment and enable them to undertake strategic growth initiatives. Contact Us: Ryan Shaw Hexa Research Felton Office Plaza 6265 Highway 9 Felton, California 95018 United States Phone: +1-800-489-3075 Email: sales@hexaresearch.com Website - http://www.hexaresearch.com/ Follow Us: