Download
1 / 114
1.14k likes | 1.41k Views
The Relationship Between Audience Engagement and Our Ability to Perceive the Pitch, Timbre, Azimuth and Envelopment of Multiple Sources. David Griesinger Consultant Cambridge MA USA www.DavidGriesinger.com. Overview.

E N D
The Relationship Between Audience Engagement and Our Ability to Perceive the Pitch, Timbre, Azimuth and Envelopment of Multiple Sources David Griesinger Consultant Cambridge MA USA www.DavidGriesinger.com
Overview • This talk consists of an introduction, followed by sections from three fields. • The intro states the goal of the talk - to help build better concert halls and opera houses. • To do this we need to understand how acoustics affects the perception of sound. • Part one – Physics – describes a physical mechanism by which human hearing may detect the pitch, timbre, azimuth and distance (near/far) of several sound sources at the same time, using frequencies the range of vocal formants (1000Hz to 4000Hz.) • The acuity of these perceptions is reduced in the presence of reflections and reverberation in a consistent and predictable fashion. • The consequence of this reduction in acuity is the perception of distance from the source, and a loss in excitement or engagement with the performance. • A computer model of this mechanism can be used to measure the psychological clarity of a hall from recordings of live music. • Part two – Psychology – discusses the psychological importance of the perception of “near” and “far” on the ability of a sound to hold the attention of the audience. • And makes a plea for hall and opera designs that maximize audience engagement • Part three – Acoustics – looks at the acoustic reasons certain concert halls are more engaging than others. • Hall shape does not scale. A shoebox shape that works for a hall with 2000 seats large hall will produce muddy sound over a wide range of seats if it is scaled to 1000 seats • Rectangular diffusing elements – coffers and niches – act as frequency dependent retro-reflectors, and are an essential ingredient in maintaining high clarity over a large number of seats.
Warning! Radical Concepts Ahead! • The critical issue is the amount, the time delay, and the frequency content of early reflections relative to the direct sound. • If the direct to reverberant ratio above 700Hz is above a critical threshold, early energy and late reverberation can enhance the listening experience. But, if not… • Reflections in the time range of 10 to 100ms reduce clarity, envelopment, and engagement – whether lateral or not. • and the earliest reflections are the most problematic. • Reflections off the back wall of a stage or shell decrease clarity • They are typically both early and strong – and interfere with the direct sound. • Side-wall reflections are desirable in the front of a hall, but reduce engagement in the rear seats. • They are earlier, and stronger relative to the direct sound in the rear. • Reflections above 700Hz directed into audience sections close to the sound sources have the effect of reducing the reflected energy in other areas of the hall – with beneficial results. • These features increase the direct/reverberant ratio in the rear seats • And attenuate the upper frequencies from side-wall reflections in the rear. • Coffers, niches, and/or open ceiling reflectors are invariably present in the best shoebox halls.
A few that work – note the rectangular coffers and niches Boston Symphony Hall Amsterdam Concertgebouw Vienna Grosse Musikverreinsaal Tanglewood Music Shed
Nice try … – and there are plenty more… Avery Fisher Hall, New York Alice Tully Hall, New York Kennedy Center Washington, DC Salle Playel, Paris
Introduction • This talk is centered on the properties of sound that promote engagement– the focused attention of a listener. • Engagement is usually subconscious – and the study of its dependence on acoustics has been neglected in most acoustic research. • At some level the phenomenon is well known: • Drama and film directors insist that performance venues be acoustically dry, with excellent speech clarity and intelligibility. • As do producers and listeners of popular music, and customers of electronically reproduced music of all genres. • The same acoustic properties that create excitement in a play or film can increase the impact of live classical music – but many current halls and opera houses are not acoustically engaging in a wide range of seats. • Halls with poor engagement decrease audiences for live classical music. • Engagement is associated with sonic clarity – but currently there is no standard method to quantify the acoustic properties that promote it. • Acoustic measurement s such as “Clarity 80” or C80, were developed to quantify intelligibility, not engagement. • Venues often have adequate intelligibility – particularly for music – but poor engagement • Acoustic engineers and architects cannot design better halls and opera houses without being able to specify and verify the properties they are looking for. • So we desperately need measures for the kind of clarity that leads to engagement.
The story of “near”, “far”, and harmonic coherence • The author has been fascinated with engagement for a long time • particularly the perception of muddiness in a recording, and the lack of dramatic clarity in a hall or opera house. • This fascination led to a discovery that a major determinant of engagement was the perception of “near” and “far”, • which humans can determine immediately on hearing a sound, even with only one ear, or with a single channel of recorded sound. • The perception has vital importance, as it subconsciously determines the amount of attention we will pay to a sound event. • The importance of this perception, and the speed with which we make it, argue that determining “near” and “far” is a fundamental property of sound perception. • But how do we perceive it, and how can it be measured? • In searching for the answer, the author found that engagement, “near” and “far”, pitch perception, timbre perception, and direction detection are all related to the same property of sound: • the phase coherence of harmonics in the vocal formant range, ~1000Hz to 4000Hz. Example: The syllables one to ten with four different degrees of phase coherence. The sound power and spectrum of each group is identical
Near, far, and sound localization • The first step to the realization of the fundamental importance of phase coherence came from author’s listening experience, which suggested that the perception of “near” and “far” is closely related to the ability to accurately identify the direction of a sound source. • When individual musicians in a small classical music ensemble sounded engaging and close to the listener, they could be accurately localized. • And when they sounded distant and non-engaging, they were difficult to localize. • Engagement is mostly sub-conscious and difficult to quantify – but localization experiments are relatively easy to perform – so I studied localization. • Experiments with several subjects showed that the ability to localize sounds in a reverberant environment depends on frequencies between 700Hz and 4000Hz, • and that poor localization occurs when the sum of early reflections in the time range from 5ms to 100ms from any direction becomes stronger than the direct sound. • The earlier a reflection comes, the larger is its detrimental effect. • With the help of localization data it was possible to construct a measure for the ability to localize sound in a reverberant environment. • The input to the measure is a measured or calculated binaural impulse response at a particular seat, – ideally with an occupied hall and stage.
Equation for Localizability – 700 to 4000Hz • We can use a simple model to derive an equation that gives us a decibel value for the ease of perceiving the direction of direct sound. The input p(t) is the sound pressure of the source-side channel of a binaural impulse response. • We propose the threshold for localization is 0dB, and clear localization and engagement occur at a localizability value of +3dB. • Where D is the window width (~ 0.1s), and S is a scale factor: • Localizability (LOC) in dB = • The scale factor S and the window width D interact to set the slope of the threshold as a function of added time delay. The values I have chosen (100ms and -20dB) fit my personal data. The extra factor of +1.5dB is added to match my personal thresholds. • Further description of this equation is beyond the scope of this talk – but it is explained on the author’s web-page.. S is the zero nerve firing line. It is 20dB below the maximum loudness. POS in the equation belowmeans ignore the negative values for the sum of S and the cumulative log pressure.
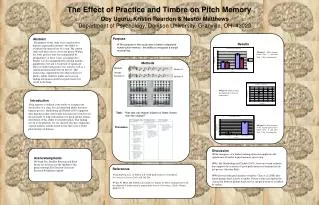
Broadband Speech Data verifies the LOC equation: Blue – experimental thresholds for alternating speech with a 1 second reverb time. Red – the threshold predicted by the localization equation. Black – experimental thresholds for RT = 2seconds. Cyan – thresholds predicted by the localization equation.
Measures from live music • Binaural impulse responses from occupied halls and stages are very difficult to obtain! • But if you can hear something, there must be a way to measure it. • Part one of this talk describes a physiologically derived model of human hearing. The model arose from the search for a measure for “near” and “far”. • But the model is capable of explaining (and measuring) far more. • The model provides a means of separating sounds from multiple sources into independent neural streams, • And allows independent analysis of each stream for pitch, timbre, and azimuth. • The model may not be neurologically correct in detail • But it predicts many known properties of human hearing, and shows that all of them depend on the phase coherence of the incoming sound. • It provides a method that this phase coherence can be measured from binaural recordings of live music. • This model is the subject of part one of this talk. Parts two and three show why the model is needed.
Part one – Physics • Part one describes a physical mechanism by which human hearing could detect pitch, timbre, azimuth and distance (near/far) of several sound sources at the same time, using the phase coherence of harmonics in the range of vocal formants (1000Hz to 4000Hz.) • The model is built from functions that are known to be present in human hearing. • Signals from the basilar membrane are analyzed not just for their average amplitude, but for modulations produced by interference between harmonics. • This information derives from the phase relationships between harmonics . • A conceptually simple mechanism is suggested that allows the information from these modulations to be separated into independent neural streams, one for each sound source. • This this mechanism explains our uncanny abilities to detect the pitch, timbre, azimuth and distance of several sources at the same time. • And it also predicts the observed decrease in these abilities in the presence of reflections. • The model need not be entirely correct to support the main point of this talk, which is that the model’s success in predicting what is and is not audible strongly supports the conclusions of part two and part three. • The phase coherence of harmonics in the vocal formant range give rise to our abilities to separate sounds from multiple sources, and independently perceive pitch, timbre, azimuth, and distance for each source. • The acuity of these perceptions is reduced in the presence of reflections and reverberation in a consistent predictable, and measureable fashion. • In the absence of this acuity sources become psychologically distant and non-engaging. • The model provides a means for measuring the degree of phase coherence – and thus the engagement – in an individual seat using only live sound as an input.
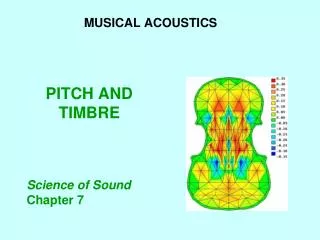
Perplexing Phenomena • The frequency selectivity of the basilar membrane is approximately 1/3 octave (~25% or 4 semitones), but musicians routinely hear pitch differences of a quarter of a semitone (~1.5%). • Clearly there are additional frequency selective mechanisms in the human ear. • the fundamentals of musical instruments common in Western music lie between 60Hz and 800Hz, as do the fundamentals of human voices. • But the sensitivity of human hearing is greatest between 500Hz and 4000Hz, as can be seen from the IEC equal loudness curves. Blue: 80dB SPL ISO equal loudness curve. Red: 60dB equal loudness curve The peak sensitivity of the ear lies at about 3kHz. Why? Is it possible that important information lies in this frequency range?
More Perplexing Phenomena • Analysis of frequencies above 2kHz would seem to be hindered by the maximum nerve firing rate of about 1kHz. • Why has evolution placed such emphasis on a frequency range that is difficult to analyze directly? • A typical basilar membrane filter above 2kHz has three or more harmonics from each instrument within its bandwidth • How can we possibly separate them? • How is it possible that in a good hall we can routinely detect the azimuth, pitch, and timbre of three or more sound sources (musicians) at the same time? • Even in a concert where a string quartet subtends an angle of +-5 degrees or less! (The ITDs and ILDs are miniscule…) • Why do some concert halls prevent you from hearing several musical lines at once? • And what can be done about it? • The hair cells in the basilar membrane respond mainly to negative pressure – they approximate half-wave rectifiers, which are strongly non-linear devices. How can we claim to hear distortion at levels below 0.1% ? • Why do many creatures – certainly all mammals – communicate with sounds that have a defined pitch? • Is it possible that pitched sounds have special importance to the separation and analysis of sound?
Answers • Answers become clear with two basic realizations: • 1.The phase relationships of harmonics from a complex tone contain more information about the sound source than the fundamentals. • 2. And these phase relationships are scrambled by early reflections. • For example: my speaking voice has a fundamental of 125Hz. • The sound is created by pulses of air when the vocal chords open. • Which means that exactly once in a fundamental period all the harmonics are in phase. • A typical basilar membrane filter at 2000Hz contains at least 4 of these harmonics. • The pressure on the membrane is a maximum when these harmonics are in phase, and reduces as they drift out of phase. • The result is a strong amplitude modulation in that band at the fundamental frequency of the source. • When this strong modulation is absent, or noise-like, the sound is perceived as distant.
Basilar motion at 1600 and 2000Hz Top trace: A segment of the motion of the basilar membrane at 1600Hz when excited by the word “two” Bottom trace: The motion of a 2000Hz portion of the membrane with the same excitation. The modulation is different because there are more harmonics in this band. In both bands there is strong amplitude modulation of the carrier, and the modulation is largely synchronous. When we listen to these signals the fundamental is easily heard In this example the phases have been garbled
Nerve firing rates This picture shows the amplitude envelope of the previous picture, plotted in dB. It represents the rate of nerve firings from each band. The rate varies over a sound pressure range of 20dB. Nerve cells act like an AM radio detector, which recovers the frequency and amplitude of the modulation, while filtering away the frequency of the carrier. Like the detectors in AM radios, the hair cells (probably) include AGC (automatic gain control) – with about a 10ms time constant. The response over short times is linear, but appears logarithmic over longer periods.
AM Radio • AM radio consists of a carrier at a fixed high frequency that has been linearly modulated by low frequency signals. • An AM receiver half-wave rectifies the carrier, and filters out the high frequency components. • What remains is the recovered low frequency signals. • So an AM radio receiver uses a strongly non-linear device to recover a linear signal. • But the rectification process can be viewed as a kind of sampling – it also produces aliases of the modulation. • In the case of an AM radio the aliases are at very high frequencies, and can be easily filtered away. • In the basilar membrane the carrier is close to the frequencies of the modulation – and the aliases can be problematic.
Amplitude modulation of a noisy carrier • The motion of the basilar membrane when excited by phase-coherent harmonics appears to be an amplitude modulated carrier – but the carrier is not a fixed frequency, but an artifact of a filter with a finite bandwidth. • And the frequency of the carrier is within the audio band. • Thus, rectification by the hair cells produces aliases that are both broad-band and highly audible. Spectrum of the syllable “three” from the rectified and filtered 2000Hz 1/3 octave band (blue) and the 2500Hz 1/3 octave band. (red) Note the fundamental frequency and its second harmonic are the same in both bands. The garbage is different.
Recovering a linear signal • To recover a linear signal from these hair cells we need to have to combine and compare the outputs from many overlapping critical bands. • The aliases in each band are different because the carriers have different frequencies – but the modulations we wish to hear are nearly the same. • Since for most signals the artifacts are not constant in time – we must also average the hair-cell firings over a period of time. • My data suggests an averaging time of 100ms. • Because the carrier is broad-band, the aliases are also broad-band. • The signals are generally narrow band – so broad band signals may be ignored. • Our hearing mechanism does all of these things.
A Pitch Detection Model A neural daisy-chain delays the output of the basilar membrane model by 22us for each step. Dendrites from summing neurons tap into the line at regular intervals, with one summing neuron for each fundamental frequency of interest. Two of these sums are shown – one for a period of 88us, and one for a period of 110us. Each sum produces an independent stream of nerve fluctuations, each identified by the fundamental pitch of the source.
Pitch acuity – A major triad in two inversions Solid line - Pitch detector output for a major triad – 200Hz, 250Hz, 300Hz Dotted line – Pitch detector output for the same major triad with the fifth lowered by an octave: 200Hz, 250Hz and 150Hz. Note the high degree of similarity, the strong signal at the root frequency, and the sub-harmonic at 100Hz
Summary of model • We have used a physiological model of the basilar membrane to convert sound pressure into demodulated fluctuations in nerve firing rates for a large number of overlapping (critical) bands. • Our physiological model of the frequency separation mechanism is capable of analyzing the modulations in each band into perhaps hundreds of frequency bins. • Strong, narrow-band signals at particular frequencies are selected for further processing • The result: we have separated signals from a number of sources into separate neural streams, each containing the modulations received from that source. • These modulations can then be compared across bands to detect timbre, and IADs and ILDs can be found for each source to determine azimuth.
Advantages • The separated streams from each source can be easily analyzed for timbre, ITD and ILD with known neural circuits. • The model is conceptually simple – it is built out of a (large) number of building blocks that are known to exist in human neurology. • It is easy to see how it could have evolved. • The circuit is fast. Useful data on timbre, ITD, and ILD is available within 20ms of the first input. • As the sound is held pitch and azimuth acuity increases. • Because the ILD is created by high frequency harmonics, small differences in azimuth can create large differences in level • Thus azimuth acuity is high enough to explain our ability to localize musicians.
Speech without reverberation: 1.6kHz-5kHz Note that the voiced pitches of each syllable are clearly seen. Since the frequencies are not constant, the peaks are broadened – but the frequency grid is 0.5%, so you can see that the discrimination is not shabby.
Speech with reverberation: RT=2s, D/R -10dB The binaural audio sounds clear and close. If we convolve speech with a binaural reverberation of 2 seconds RT, and a direct/reverberant ratio of -10dB the pitch discrimination is reduced – but still pretty good!
Speech with reverberation: RT=1s, D/R -10dB The binaural audio sounds distant and muddy. When we convolve with a reverberation of 1 seconds RT, and a D/R of -10dB the brief slides in pitch are no longer audible – although most of the pitches are still discernable, roughly half the pitch information is lost. This type of picture could be used as a measure for distance or engagement.
Two violins recorded binaurally, +-15 degrees azimuth Left ear - middle phrase Right ear - middle phrase Note the huge difference in the ILD of the two violins. Clearly the lower pitched violin is on the right, the higher on the left. Note also the very clear discrimination of pitch. The frequency grid is 0.5%
The violins in the left ear – 1s RT D/R -10dB When we add reverberation typical of a small hall the pitch acuity is reduced – and the pitches of the lower-pitched violin on the right are nearly gone. But there is still some discrimination for the higher-pitched violin on the left. Both violins sound muddy, and the timbre is poor!
Timbre – plotting modulations across critical bands • Once sources have been separated by pitch, we can compare the modulation amplitudes at a particular frequency across each 1/3 octave band, from (perhaps) 500Hz to 5000Hz. • The result is a map of the timbre of that particular note – that is, which groups of harmonics or formant bands are most prominent. • This allows us to distinguish a violin from a viola, or an oboe from a clarinet. • I modified my model to select the most prominent frequency in each 10ms time-slice, and map the amplitude in each 1/3 octave band for that frequency. • The result is a timbre map as a function of time. • The mapping works well if there is only one sound source.
Timbre map of the syllables “one two” All bands show moderate to high modulation, and the differences in the modulation as a function of frequency identify the vowel. Note the difference between the “o” sound and the “u” sound.
Timbre map of the syllables “one two” with reverberation 2s RT -10dB D/R All bands still show moderate to high modulation, and the differences in the modulation still identify the vowel. The difference between the “o” sound and the “u” sound is less clear, but still distinguishable.
Timbre map of the syllables “one two” with reverberation 1s RT -10dB D/R The clarity of timbre is nearly gone. The reverberation has scrambled enough bands that it is becoming difficult (although still possible) to distinguish the vowels. A one-second reverberation time creates a greater sense of distance than a two second reverberation because more of the reflected energy falls inside the 100ms frequency detection window.
Non-coherent sources • So far I have been considering only sources that emit complex tones with a distinct pitch. • What about sources that are not coherent, like a modern string section with lots of vibrato, or pink noise? • Nearly any sound source – when band-limited – creates noise-like modulations in the filtered output. • Pink noise is no exception. Narrow-band filter it, and the amplitude fluctuates like crazy. • Sources of this type cannot be separated by frequency into separate streams – but they can be sharply localized, both by ITD and ILD. • This explains why in a good hall we can easily distinguish the average azimuth of a string section. • If the strings play without vibrato they are perceived as a single instrument, with no apparent source width!
Example – Pink noise bursts with identical ILDs During the 10ms rise-time the noise is identical in the left and right channels. After 10ms, the noise in the right channel is delayed by 100us. The next burst in the series is identical, but the left and right channels are swapped. When you listen to this on headphones (or speakers) the sound localizes strongly left and right. • I created a signal that consists of a series of pink noise bursts, one of which is shown below. The noise is sharply high pass filtered at 2kHz. Azimuth is determined by the ITDs of the modulations – not the onset
Summary of part 1: • We have shown that the human ear has evolved to analyze fluctuations or modulations in the amplitude of the basilar membrane motion at frequencies above 1000Hz. • And not necessarily the average amplitude of the motion. • So long as the phases of the harmonics that create the modulations are not altered by reflections, the modulations from each source can be separated by frequency, and separately analyzed for pitch, timbre, azimuth, and distance. • The modulations – especially when separated – carry more information about the sound sources than the fundamental frequencies. • And allow precise determination of pitch, timbre, and azimuth. • All of these perceptions depend on the ear’s ability to perceive the direct sound from the source!!! (And there is currently no standard measure…) • Reflections from any direction – particularly early reflections – scramble these modulations and create a sense of distance and disengagement. • But they are only detrimental to music if they are too early, and too strong. • The C language model presented above makes it possible to visualize the degree to which timbre and pitch can be discerned in a recording of live music. • With calibration a single-number measure for engagement should be possible.
Direct sound and Envelopment • Recent work by the author in both experiments with several subjects, and in live lecture demonstrations with loudspeakers, has shown that the sense of both reverberance and envelopment increases when the direct sound is separately perceived. • Where there is no perceivable direct sound the sound can be reverberant, but comes from the front. • When the direct sound is above the threshold of localization the reverberation becomes louder and more spacious. • Envelopment and reverberance are created by late energy – at least 100ms after the direct sound. • When the direct sound is inaudible the brain cannot perceive when a sound has started. • So effectively the time between the onset of the direct sound and the reverberation is reduced, and less reverberation is heard. • In the absence of direct sound syllabic sound sources (speech, woodwinds, brass, solo instruments of all kinds) are perceived as in front of the listener, even if reflections come from all around. • The brain will not allow the perception of a singer (for example) to be perceived as all around the listener. • In addition, Barron has shown that reverberation is always stronger in front of a hall than in the rear – so in most seats sound decays are perceived as frontal. • But when direct sound is separately perceived, the brain can create two separate sound streams, one for the direct sound (the foreground) and one for the reverberation (the background). • A background sound stream is perceived as both louder and more enveloping than the reverberation in a single combined sound stream.
Time for Demos • I will attempt to demonstrate the effects of the direct sound on the perception of distance, muddiness, and envelopment. • The four speakers around the audience will play reverberation as it might exist in a hall. • The center channel will produce the direct sound. • The D/R will vary depending on where you are sitting. • And I will vary it to give everyone a chance to hear the effects near the threshold of audibility for the direct sound.
Part 2: Near, Far, and Engagement • The apparent closeness of a sound source is a fundamental perception for all of us. • We can tell instantly if a person talking is within a few feet of us, or further away – and this perception has survival value. • The perception of “Near” depends critically on our ability to perceive the direct sound – the sound that travels to the listener without reflecting. • Surprisingly, in a theater or hall it is possible to perceive the performers as both acoustically close to the listener and enveloped by the hall. • The best halls (Boston Symphony Hall, Concertgebouw, the front half of the Musikverrein) provide both, but many, perhaps most, provide only reverberation. • Harmonic coherence of speech and music is a principle cue for perceiving near and far. • The audio examples in the click box above show the decrease in apparent distance caused by increasing amounts of harmonic coherence. • Note that all of the examples have high intelligibility – but their emotional effect is quite different. • The perception of “near” and “far” correlates with ability to localize sound sources – and the ability to separately hear several musical lines at the same time.
Amplitude modulation analysis – direct sound Spoken syllables “one” to “ten” analyzed by the neural model presented in Part one. Note the clear detection of the pitch of each vowel
Amplitude modulation analysis “one” to “ten” with 88ms all-pass reflections Note the pitch acuity has been reduced, along with the signal to noise ratio.
Amplitude modulation analysis “one” to “ten” with 133ms reflections The pitch discrimination with this analysis model (an early one) is poor with these reflections.
Experiences – Staatsoper Berlin Barenboim gave Albrecht Krieger and me 20 minutes to adjust the LARES system in the Staatsoper. My initial setting was much to strong for Barenboim. He wanted the singers to be absolutely clear, with the orchestra rich and full – a seemingly impossible task. Adding a filter to reduce the reverberant level above 500Hz by 6dB made the sound ideal for him. The house continues with this setting today for every opera. Ballet uses more of a concert hall setting – which sounds amazingly good. In this example the singers have high clarity and presence. The orchestra is rich.
Experiences – Bolshoi – a famously good hall for opera The Bolshoi is a large space with Lots of velvet. RT is under 1.2 seconds at 1000Hz, and the sound is very dry. Opera here has enormous dramatic intensity – the singers seem to be right in front of you – even in the back of the balconies. It is easy for them to overpower the orchestra This mono clip was recorded in the back of the second balcony. In this clip the orchestra plays the reverberation. The sound is rich and enveloping
New Bolshoi before modification The Semperoper was the primary model for the design of the new Bolshoi. As in Dresden the sound on the singers is distant and muddy, and the orchestra is too loud. RT ~1.3 seconds at 1000Hz. New Bolshoi Dresden What is it about the SOUND of this theater that makes the singers seem so far away? This theater suffers greatly from having the old Bolshoi next door! (The theater has received poor reviews from musicains and the press.)
Experiences – Amsterdam Muziektheater • Peter Lockwood and I spent hours adjusting the reverberant level using a remote in the hall. • He taught me to hear the point where the direct sound becomes no longer perceptible, and the sonic distance dramatically increases. • With a 1/2 dB increase in reverberant level, the singer moved back 3-4 meters. • In Copenhagen, I once decreased the D/R by one dB while Michael Schonwandt was conducting a rehearsal. He immediately waved to me from the pit, and told me to put it back. • Given a chance to listen A/B, these conductors choose dramatic intensity over reverberance. • When they do not have this chance, reverberation is seductive, and the singers be damned!
Experiences, Copenhagen New Stage We were asked to improve loudness and intelligibility of the actors in this venue. 64 Genelec 1029s surround the audience, driven by two line array microphones, and the LAREAS early delay system. A gate was used to remove reverberation from the inputs. 5 drama directors listened to a live performance of Chekhov with the system on/off every 10 minutes. The result was unanimous – “it works, we don’t like it.” “The system increases the distance between the actors and the audience. I would rather the audience did not hear the words than that this connection is compromised.”
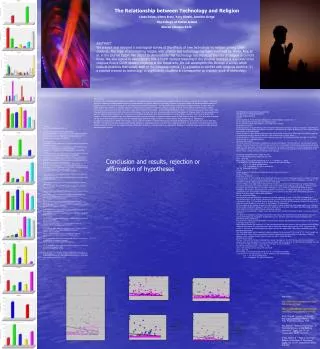
A slide from Asbjørn Krokstad - IoA,NAS Oslo 2008 [With permission] To succeed: [in bringing new audience into concert halls…] ENGAGING “Interesting” "Nice” [We need to make the sonic impression of a concert engage the audience – not just the visual and social perceptions. Especially since audiences are increasingly accustomed to recordings!]
ENGANGEMENT, not NICE • At the IoA conference in Oslo, Asbjørn Krokstad (a musician, conductor, and Norway’s best-known acoustician) gave a lecture where he insisted that acousticians needed to provide engagement, not just pleasant music. • And not just for drama and opera, but for chamber music and symphony too. • At the end of the lecture he showed a picture of the Teatro Colónin Buenos Aires, Argentina. “Is this the concert hall of the future” he asked? • This hall is not a shoebox, but a large semicircular theater with a high ceiling. It ranks at the top in Beranek’s surveys, and the reverberation time is 1.6 seconds occupied. • Krokstad may have conducted there. • Engagement requires the independent perception of the direct sound • We must learn how to provide this essential element in halls. • I have been fortunate to hear several of the live broadcasts of the Metropolitan Opera in a good theater. For example, the performance of Salome: • The sound was harsh and dry – radio mikes coupled to directional loudspeakers. But you could hear every syllable of Mattila’s impeccable German. The performance was totally gripping! • This is the dramatic and sonic experience audiences increasingly demand.