Download

1 / 11
120 likes | 343 Views
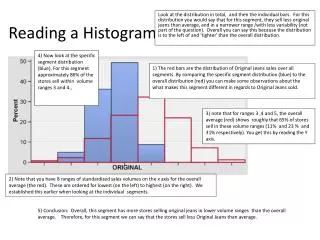
Building a Histogram in Excel. IE 1225 R. Lindeke. After Opening Excel …. Click: Tools … Add-Ins … Then Check: Analysis Toolpak Box. Enter Team/Individual Averages:. Each Team has no-replicates? Need Averages for both Diameter & Length – we will build a histogram of each!.

E N D
Building a Histogram in Excel IE 1225 R. Lindeke
After Opening Excel … Click: Tools … Add-Ins … Then Check: Analysis Toolpak Box
Enter Team/Individual Averages: Each Team has no-replicates? Need Averages for both Diameter & Length – we will build a histogram of each!
Determine Overall Range: Excel Formulas! =Max(C3:C32) =Min(C3:C32) Both Columns – diameter & Length
Excel Formula Too! Largest ‘Max’ to Smallest ‘Min’ Examine the Overall Range – Want 6 to 10 “Bins” covering this Range
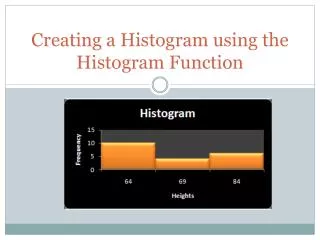
In Histogram Box Click the ICON then highlight Ranges for Data (Input Range box) and Segment Limits (Bin Range box) … Put Histogram on Separate WorkSheet!
Final Output: Experiment with Smaller Bins sizes (more bins across Overall Range)