Download

1 / 36
360 likes | 515 Views
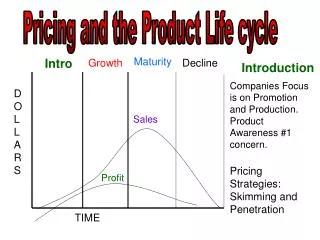
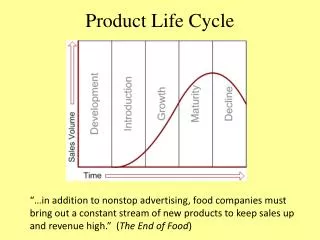
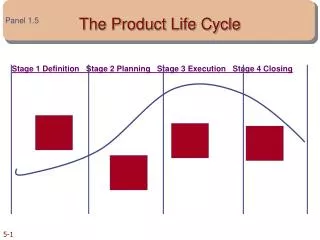
THE QUEST FOR BETTER DEFINITION OF THE PRODUCT LIFE CYCLE - AND CONSEQUENCES FOR LICENSING. John Ansell John Ansell Consultancy Thame, Oxfordshire, UK. LES Chelsea Village 27 June 2003. THE QUEST FOR BETTER DEFINING THE PLC - AND CONSEQUENCES FOR LICENSING .

E N D
THE QUEST FOR BETTER DEFINITION OF THE PRODUCT LIFE CYCLE - AND CONSEQUENCES FOR LICENSING John Ansell John Ansell Consultancy Thame, Oxfordshire, UK LES Chelsea Village 27 June 2003
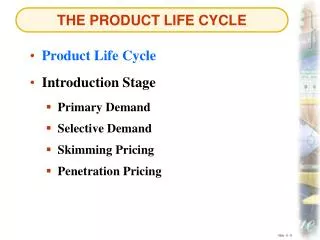
THE QUEST FOR BETTER DEFINING THE PLC - AND CONSEQUENCES FOR LICENSING • 1. Calculating Life Cycle Length: Longevity • 2. Assessing Trends in Longevity • The Impact on Commercial Potential of Correcting Longevity • Better Defining the PLC Curve Sharpe • Overall Consequences for Licensing
Longevity - Definition • “ Time from first launch to peak sales ” • a practical representation of product life span • e.g. Prozac • First launched Belgium 1986 • Year of global peak sales 1998 • Hence global longevity = 12 years
Why do products peak ? • Exhaustion of patents rights • - but NB often beyond expiration of base patent • Competition • e.g. Zantac peaked 2 years before patent expiry • - competition from Pri/Losec • ADRs • eg Prepulsid (cisapride) – cardiac arrhythmias
Longevity for selected products from global Top 50 John Ansell Consultancy / Decision Resources (2001)
• 12/50 products have already peaked Average longevity = 11.8 years • But of the remaining 38 products yet to peak - excluding Premarin - 11 products already > 11.8 years • Adding years they have achieved so far: Average longevity for Top 50 = 13.0 years Calculating average longevity for 2001 Top 50 global products
Surely 13 years is a function of large size?
How representative are the Top 50 products ? • All products down to $100 million global sales per annum in 2000 analyzed. • 380 products in all. Searched for those that had peakedin 2000. Total = 40 (11%). • But little correlation between size of product and longevity: • Average longevity is 10.7 years compared with the Top 50 (6 products) = 12.3 years. John Ansell Consultancy / Decision Resources (2001).
Little correlation between product size and longevity John Ansell Consultancy (2001) based on electronic data from Evaluate Pharma. • Immediately below Top 50, longevities greater than for Top 50 itself. • And remarkably, for the 12 smallest peaking products in lowest, $200 million-$100 million band, average is 11.0 years, slightly above average of 10.7 years for all 40 peaked products.
Trends in average longevity, 1994-2002 Source: John Ansell Consultancy (2003)
Longevities of Top 50 products, 1994 and 2001 Source: John Ansell Consultancy / Decision Resources (2001) • A cohort of established products 13+/14+ years on the market • by 2001 continue to make headway: • 13+: Zocor, Procrit Claritin, Epogen, Diflucan • 14+ Cipro, Lovenox, Prinivil, Zyrtec • These products have helped to bolster product longevity.
Trends: 1994-2001 Top 50s – Decline of the Golden Oldies • •In 1994, five golden oldies (> 20 years old) represented in Top 50. • E.g. Ortho-Novum (then 32+ yr). But most have now disappeared • recently: Adalat26 yr,Voltaren23 yr, Atrovent 21 yr. • Departure of golden oldieshas often contributed to reduction then • in average longevity. • In particular: drop in 1998 coincided with departure of • Ortho-Novum35+ yr,Ventolin 26 yr & Atrovent21 yr. • • Very few golden oldies now left to drop out of Top 50. • Soon, oldest product likely to be Intron A (currently 17+ years). • Hence this factor is running out of steam.
Trends: 1994-2001 Top 50s – Getting younger & healthier •A fairly strong group of young, yet-to-peak products have recently been entering Top 50. •By 2001, 8 products with longevity of 4+ years or less in Top 50 – Highest number in any year. Should help to stabilise longevity in future.
Factors increasing product longevity since 1990 …and likely impact to 2015 Patents/exclusivity • USA--1984 Hatch-Waxman legislation gave up to five more years protection – growing positive impact since 1990. “Evergreening” of products has strengthened effect. Clamp-down by President Bush (Oct 2002) likely to “prematurely” terminate patents on products, quickly forcing down longevity. •Europe--Supplementary Protection Certificates from mid-1980s. Impact continues.Possible extension of exclusivity periods by EC in near future. • Japan--1988 patent term restoration legalisation. • Impact continues.
Factors increasing product longevity since 1990 …and likely impact to 2015(cont’d) • TRIPS (1994) Modest positive effect – as additional coverage • is not for major markets. Subsequently undermined. • Difficulty for generic companies to introduce biotech generics • Few signs of solutions/regulatory mechanisms: increasing impact. • Faster regulatory review--particularly by FDA. • Appointment of new Commissioner - hopefully - will revive Agency. • Our research over 1994-2001 period shows • Top 50 has become “healthier” • No golden oldies left to drop out • and further reduce average longevity.
•Average time to bring product to market shows signs of increasing again: CMR International member company data (2000): 1996: 11 years 1999: 13 years. May increase further – though genomics could in time help to reduce. Factors decreasing longevity since 1990 …and likely impact to 2015 •Companies achieving faster global roll outs Still continuing, though effect likely to moderate. • Increasing competition — very powerful factor — likely to intensify further, apart from possible short-term decline resulting from sharply-falling number of new products. But from about 2006/2007, projected to increase - hence promotion will intensify further.
Conclusions • Longevity has been declining in recent years • despite impact of all patent term restoration/data exclusivity • legislation – which must have had positive effect. • Net impact of all factors is continuing decline • Assumption for products to 2010: • - but reasonable to assume average longevity will stay • above 12 years till end of current decade at least.
The Impact on Commercial Potential • of Correcting Longevity
The Impact on Commercial Potential of Correcting Longevity ‡ • Some current forecasting still assumes 6, 5 or even 3 years though 10 years now becoming more common. - but still way short of 12 years suggested above. • Impact of revised longevity varies depending on current assumptions - but will often be at least two-fold. • Risk Added years normally ought to be favourably discounted – as chances of attaining turnovers of an already-growing product should be good. ____________________________________________________________________ ‡Material in this section covered in detail in: Ansell. J, More Mileage Than Meets the Eye: Revealing True Product Potential and Its Impact, Pharmaceutical Industry Dynamics, Spectrum, Decision Resources, May 2000. Ansell, J, Quantifying New Product Needs: Productivity Targets Considered at Company Level, Pharmaceutical Industry Dynamics, Spectrum, Decision Resources (in press).
• Justifies devoting more efforts to additional indications / presentations. further extension of longevity. Impact of Correcting Longevity (cont’d) •Reduction of threshold for new product viability: for GP product in typical major company, has been $600-800 million. But companies now becoming more flexible on cut-off. • Means need for more-sustained promotion – but such investment will usually be below average risk – with quick pay-off. • Average output from top 20 companies of 1.5 products/annum (c.f. current productivity of 1 per annum) could well be sufficient to survive and prosper.
Impact of Correcting Longevity – a Limitation ! • NB – averages take you only so far… Wide variation between products –in 2002 Top 50 longevity from: 2 years e.g. Celebrex to 20 years Augmentin!
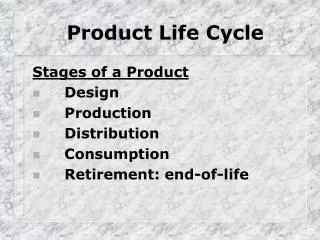
4. Better Defining PLC Curve Shape There are many different routes to the peak.
S-shaped curves John Ansell Consultancy / Decision Resources based on electronic data from Evaluate Pharma.
The full S-shape John Ansell Consultancy/ Decision Resources based on electronic data from Evaluate Pharma.
Gradual build-up John Ansell Consultancy, Decision Resources based on electronic data from Evaluate Pharma.
Slow starters John Ansell Consultancy, Decision Resources based on electronic data from Evaluate Pharma.
Start - stop - start products John Ansell Consultancy /Decision Resources based on electronic data from Evaluate Pharma.
Start - stop - start - stop - start … John Ansell Consultancy, Decision Resources based on electronic data from Evaluate Pharma.
5. Overall consequences for licensing • Don’t undervalue your IP by underestimating longevity • Reassess corporate needs depending on any adjustment: • - How many new products do you really need to acquire rights to ? • - Can you lower turnover threshold for new product viability ? • E.g. look for viable medium-sized products to add to • existing core therapeutic areas. • - Do you really need to merge ?
Overall consequences for licensing (cont’d) • Valuation of commercial potential of IP is fundamental • to eventual terms for any deal. • Commercial potential is function of Area Under the Curve (AUC), • a factor of: • – Time i.e. product life span (approximated by product longevity). • – Shape of sales curve.
Overall consequences for licensing (cont’d) • Since our curves showed wide variation in shape • as well as in length: • – Avoid being orders of magnitude out with forecasting • by individualising assumptions: • Product-by-product forecasting advisable whenever possible. • Cost of revising assumptions, tailoring forecasts: $000s • Minuscule c.f. commercial potential of products: ($m/$b).