Download
1 / 29

E N D
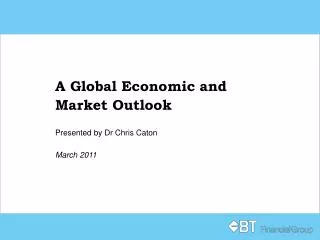
1. A Global Economic and Market Outlook November 2010
2. 2
3. 3 The Australian Dollar and US Trade Weighted Index
4. 4 Australian Sharemarket Performance � ASX200
5. 5 As a result of the recent correction the Australian market is again cheap (forward P/E ratio)
6. 6 Recoveries from �big ugly bear� markets
7. 7 Australian shares look to be good value
8. 8 US Housing starts are bumping along the bottom
9. 9 US Employment is better than it looks
10. 10 2010 Growth Forecasts (%)
11. 11 2011 Growth Forecasts (%)
12. 12 Real GDP growth in Australia and the US
13. 13 China is more important--here�s the proof
14. 14 Retail trade was so much stronger here
15. 15 Export growth *(volume, %change, 9 months to June quarter 2009)
16. 16 Our exports to China
17. 17 The Labour market is on the mend
18. 18 The resource States have led the way in jobs growth (index, March 1997=100)
19. 19 Australian Inflation
20. 20 Interest payments as a share of after-tax household income (%)
21. 21 House Prices - Australia v Adelaide
22. 22 Another look at house prices (in thousands!)
23. 23 Gross Domestic Product
24. 24 Global Medium-Term Economic Growth and Inflation Prospects (2010-2020)
25. 25 Asia-Pacific Medium-Term Economic Growth and Inflation Prospects (2010-2020)
26. 26 Morgan Stanley Capital Indexes
27. 27 Summary
28. 28 This presentation has been prepared by BT Financial Group Limited (ABN 63 002 916 458) �BT� and is for general information only.� Every effort has been made to ensure that it is accurate, however it is not intended to be a complete description of the matters described.� The presentation has�been prepared without taking into account any personal objectives, financial situation or needs.� It does not contain and is not to be taken as containing any securities advice or securities recommendation.� Furthermore, it is not intended that it be relied on by recipients for the purpose of making investment decisions and is not a replacement of the requirement for individual research or professional tax advice.� BT does not give any warranty as to the accuracy, reliability or completeness of information which is contained in this presentation.� Except insofar as liability under any statute cannot be excluded, BT and its directors, employees and consultants do not accept any liability for any error or omission in this presentation or for any resulting loss or damage suffered by the recipient or any other person.� Unless otherwise noted, BT is the source of all charts; and all performance figures are calculated using exit to exit prices and assume reinvestment of income, take into account all fees and charges but exclude the entry fee.� It is important to note that past performance is not a reliable indicator of future performance.
This document was accompanied by an oral presentation, and is not a complete record of the discussion held.
No part of this presentation should be used elsewhere without prior consent from the author.
For more information, please call BT Customer Relations on 132 135 8:00am to 6:30pm (Sydney time)
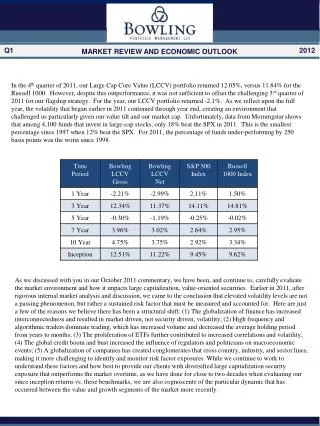
29. 29 Average interest rates on outstanding business lending