Download

1 / 62
620 likes | 1.01k Views
Using Genomics in Clinical Trial Design. Richard Simon, D.Sc. Chief, Biometric Research Branch National Cancer Institute http://linus.nci.nih.gov. BRB Website http://linus.nci.nih.gov/brb. Powerpoint presentations and audio files Reprints & Technical Reports BRB-ArrayTools software

E N D
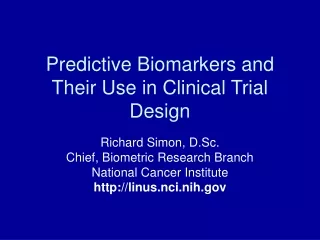
Using Genomics in Clinical Trial Design Richard Simon, D.Sc. Chief, Biometric Research Branch National Cancer Institute http://linus.nci.nih.gov
BRB Websitehttp://linus.nci.nih.gov/brb • Powerpoint presentations and audio files • Reprints & Technical Reports • BRB-ArrayTools software • BRB-ArrayTools Data Archive • Sample Size Planning for Targeted Clinical Trials
Many cancer treatments benefit only a small proportion of the patients to which they are administered • Targeting treatment to the right patients can greatly improve the therapeutic ratio of benefit to adverse effects • Treated patients benefit • Treatment more cost-effective for society
Genomic Targeting • Enables patients to be treated with drugs that actually work for them • Avoids false negative trials for heterogeneous populations • Avoids erroneous generalizations of conclusions from positive trials
“Biomarkers” • Surrogate endpoints • A measurement made before and after treatment to determine whether the treatment is working • Predictive classifiers • A measurement made before treatment to select good patient candidates for the treatment
Validation=Fit for Purpose • FDA terminology of “valid biomarker” and “probable valid biomarker” are not applicable to predictive classifiers • “Validation” has meaning only as fitness for purpose and the purpose of predictive classifiers are completely different than for surrogate endpoints
The purpose of a multi-gene predictive classifier is to predict • It is often much easier to develop an accurate predictive classifier than to elucidate the role of the component genes in disease biology
New Drug Developmental Strategy (I) • Develop a diagnostic classifier that identifies the patients likely to benefit from the new drug • Develop a reproducible assay for the classifier • Use the diagnostic to restrict eligibility to a prospectively planned evaluation of the new drug • Demonstrate that the new drug is effective in the prospectively defined set of patients determined by the diagnostic
Develop Predictor of Response to New Drug Using phase II data, develop predictor of response to new drug Patient Predicted Responsive Patient Predicted Non-Responsive Off Study New Drug Control
Applicability of Design I • Primarily for settings where the classifier is based on a single gene whose protein product is a target of the drug • Herceptin • With substantial biological basis for the classifier, it will often be unacceptable ethically to expose classifier negative patients to the new drug
We don’t think that this drug will help you because your tumor is test negative. But we need to show the FDA that a drug we don’t think will help test negative patients actually doesn’t
Evaluating the Efficiency of Strategy (I) • Simon R and Maitnourim A. Evaluating the efficiency of targeted designs for randomized clinical trials. Clinical Cancer Research 10:6759-63, 2004. • Maitnourim A and Simon R. On the efficiency of targeted clinical trials. Statistics in Medicine 24:329-339, 2005. • reprints and interactive sample size calculations at http://linus.nci.nih.gov/brb
Two Clinical Trial Designs • Un-targeted design • Randomized comparison of T to C without screening for expression of molecular target • Targeted design • Assay patients for expression of target • Randomize only patients expressing target
Efficiency relative to trial of unselected patients depends on proportion of patients test positive, and effectiveness of drug (compared to control) for test negative patients • When less than half of patients are test positive and the drug has little or no benefit for test negative patients, the targeted design requires dramatically fewer randomized patients
Treatment Benefit for Assay – Pts Half that of Assay + Pts nstd / ntargeted
Trastuzumab • Metastatic breast cancer • 234 randomized patients per arm • 90% power for 13.5% improvement in 1-year survival over 67% baseline at 2-sided .05 level • If benefit were limited to the 25% assay + patients, overall improvement in survival would have been 3.375% • 4025 patients/arm would have been required • If assay – patients benefited half as much, 627 patients per arm would have been required
Comparison of Targeted to Untargeted DesignSimon R,Development and Validation of Biomarker Classifiers for Treatment Selection, JSPI
Web Based Software for Comparing Sample Size Requirements • http://linus.nci.nih.gov/brb/
Develop Predictor of Response to New Rx Predicted Responsive To New Rx Predicted Non-responsive to New Rx New RX Control New RX Control Developmental Strategy (II)
Developmental Strategy (II) • Do not use the diagnostic to restrict eligibility, but to structure a prospective analysis plan • Having a prospective analysis plan is essential; “stratifying” (balancing) the randomization is not except that stratification ensures that all randomized patients will have tissue available • The purpose of the study is to evaluate the new treatment overall and for the pre-defined subsets; not to modify or refine the classifier • The purpose is not to demonstrate that repeating the classifier development process on independent data results in the same classifier
Analysis Plan A • Compare the new drug to the control for classifier positive patients • If p+>0.05 make no claim of effectiveness • If p+ 0.05 claim effectiveness for the classifier positive patients and • Compare new drug to control for classifier negative patients using 0.05 threshold of significance
Sample size for Analysis Plan A • 88 events in classifier + patients needed to detect 50% reduction in hazard at 5% two-sided significance level with 90% power • If test is predictive but not prognostic, and if 25% of patients are positive, then when there are 88 events in positive patients there will be about 264 events in negative patients • 264 events provides 90% power for detecting 33% reduction in hazard at 5% two-sided significance level • Sequential futility monitoring may have enabled early cessation of accrual of classifier negative patients • Not much earlier with time-to-event endpoint
Study-wise false positivity rate is limited to 5% with analysis plan A • It is not necessary or appropriate to require that the treatment vs control difference be significant overall before doing the analysis within subsets
Analysis Plan B • Compare the new drug to the control overall for all patients ignoring the classifier. • If poverall 0.03 claim effectiveness for the eligible population as a whole • Otherwise perform a single subset analysis evaluating the new drug in the classifier + patients • If psubset 0.02 claim effectiveness for the classifier + patients.
This analysis strategy is designed to not penalize sponsors for having developed a classifier • It provides sponsors with an incentive to develop genomic classifiers
Sample size for Analysis Plan B • To have 90% power for detecting uniform 33% reduction in overally hazard at 3% two-sided level requires 297 events (instead of 263 for similar power at 5% level) • If test is predictive but not prognostic, and if 25% of patients are positive, then when there are 297 total events there will be approximately 75 events in positive patients • 75 events provides 75% power for detecting 50% reduction in hazard at 2% two-sided significance level • By delaying evaluation in test positive patients, 80% power is achieved with 84 events and 90% power with 109 events
Song & Chi Refinement of Testing Procedure for Plan B • Specify 1 < < 1* • e.g. =.025, 1=.02, 1*=.10 • calculate + =.013 • Reject overall null hypothesis if • Poverall≤1 or • P+≤ + and Poverall≤ • Reject null hypothesis in test positive subset if • P+≤ + and Poverall≤1* • e.g. =.025, 1=.02, 1*=.10, + =.013
Adaptively Modifying the Types of Patients AccruedWang, O’Neill, Hung • Plan RCT to accrue N total patients • Interim futility analysis of test negative patients • If accrual of test negative patients is terminated, replace them with test positive patients to achieve the planned total N • May prolong duration of trial substantially • Futility for test negative patients declared only if efficacy for control group is superior to treatment group by specified amount • Limited opportunity to reduce number of test negative patients
Analysis Plan C • Test for interaction between treatment effect in test positive patients and treatment effect in test negative patients • If interaction is significant at level int then compare treatments separately for test positive patients and test negative patients • Otherwise, compare treatments overall
Sample Size Planning for Analysis Plan C • 88 events in classifier + patients needed to detect 50% reduction in hazard at 5% two-sided significance level with 90% power • If test is predictive but not prognostic, and if 25% of patients are positive, then when there are 88 events in positive patients there will be about 264 events in negative patients • 264 events provides 90% power for detecting 33% reduction in hazard at 5% two-sided significance level
Simulation Results for Analysis Plan C • Using int=0.10, the interaction test has power 93.7% when there is a 50% reduction in hazard in test positive patients and no treatment effect in test negative patients • A significant interaction and significant treatment effect in test positive patients is obtained in 88% of cases under the above conditions • If the treatment reduces hazard by 33% uniformly, the interaction test is negative and the overall test is significant in 87% of cases
The Roadmap • Develop a completely specified genomic classifier of the patients likely to benefit from a new drug • Establish reproducibility of measurement of the classifier • Use the completely specified classifier to design and analyze a new clinical trial to evaluate effectiveness of the new treatment with a pre-defined analysis plan.
Guiding Principle • The data used to develop the classifier must be distinct from the data used to test hypotheses about treatment effect in subsets determined by the classifier • Developmental studies are exploratory • And not closely regulated by FDA • Studies on which treatment effectiveness claims are to be based should be definitive studies that test a treatment hypothesis in a patient population completely pre-specified by the classifier
Use of Archived Samples • From a non-targeted “negative” clinical trial to develop a binary classifier of a subset thought to benefit from treatment • Test that subset hypothesis in a separate clinical trial • Prospective targeted type I trial • Using archived specimens from a second previously conducted clinical trial
Development of Genomic Classifiers • Single gene or protein based on knowledge of therapeutic target • Empirically determined based on evaluation of a set of candidate classifiers • e.g. EGFR assays • Empirically determined based on genome-wide correlating gene expression or genotype to patient outcome after treatment
Development of Genomic Classifiers • During phase II development or • After failed phase III trial using archived specimens. • Adaptively during early portion of phase III trial.
Biomarker Adaptive Threshold Design Wenyu Jiang, Boris Freidlin & Richard Simon JNCI 99:1036-43, 2007
Biomarker Adaptive Threshold Design • Randomized phase III trial comparing new treatment E to control C • Survival or DFS endpoint
Biomarker Adaptive Threshold Design • Have identified a predictive index B thought to be predictive of patients likely to benefit from E relative to C • Eligibility not restricted by biomarker • No threshold for biomarker determined
Analysis Plan • S(b)=log likelihood ratio statistic for treatment versus control comparison in subset of patients with Bb • Compute S(b) for all possible threshold values • Determine T=max{S(b)} • Compute null distribution of T by permuting treatment labels • Permute the labels of which patients are in which treatment group • Re-analyze to determine T for permuted data • Repeat for 10,000 permutations
If the data value of T is significant at 0.05 level using the permutation null distribution of T, then reject null hypothesis that E is ineffective • Compute point and bootstrap confidence interval estimates of the threshold b
Adaptive Biomarker Threshold Design • Sample size planning methods described by Jiang, Freidlin and Simon, JNCI 99:1036-43, 2007