Download

1 / 11
110 likes | 466 Views
Auto Refresh. Limit Line. Persistent Preferences. Chart Customizability ... Drill Down: Job (Repair) Efficiency Repair. The Charts Last Business ...

E N D
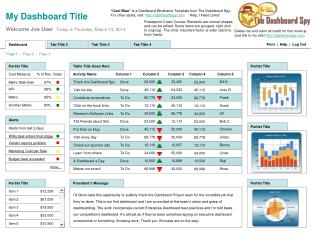
Slide 1:The FASTER Dashboard
Danny Brashear Jonathan Holloran
Slide 2:Things to Know
Questions Presenter Survey Key Performance Indicator Survey Showing the Dashboard What is included in Conference Material
Slide 3:What is the Dashboard Solution?
Dashboards Key Performance Indicators Charts and Drill Downs 19 Charts 14 Drill Downs
Slide 4:Features
Chart Layout Auto Refresh Limit Line Persistent Preferences Chart Customizability
Slide 5:The Charts � Real Time
Non Stock Parts On Order Drill Down: Orders Exceeding 24 Hours Work Order Aging Jobs (Repairs) Open, Closed, and Created Drill Down: Jobs Created by Technician Jobs (Repairs) Open on Finished Work Orders
Slide 6:The Charts � Real Time
Work Order Open to Job (Repair) Start Work Order Date Open and Status Vehicle Availability Customer Service Interruptions Drill Down: Customer Service Interruptions Detail
Slide 7:The Charts � Real Time
Downtime by Work Order Status Drill Down: Downtime Detail by Status Total Fuel Inventory PM Compliance
Slide 8:The Charts � Last Business Day
Parts Issues and Receipts Drill Down: Receipts by Vendor Drill Down: Detailed Vendor Receipts Labor Activity by Repair Code and Shop Job (Repair) Efficiency by Shop Drill Down: Job (Repair) Efficiency Repair
Slide 9:The Charts � Last Business Day
Percentage of Direct Labor Hours Drill Down: Percentage of Direct vs Indirect Labor by Technician Drill Down: Technician Detail Daily Work Order Cost by Shop Daily Fuel Issues by Fuel Site
Slide 10:The Charts - Trending
Fuel Issues for Last Month Drill Down: Fuel Issues by Department Average Price Per Gallon by Fuel Type
Slide 11:Time to Talk
What are some Key Performance Indicators you would like to see?