Download
1 / 38
380 likes | 702 Views
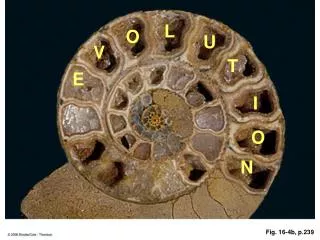
L. O. U. V. T. E. I. O. N. Fig. 16-4b, p.239. EVOLUTION = change over time which is inherited. Macroevolution: major changes of life on earth since its formation 4.6 billion years ago from fossils to present-day species 2. Microevolution:

E N D
L O U V T E I O N Fig. 16-4b, p.239
EVOLUTION = change over time which is inherited • Macroevolution: • major changes of life on earth since its formation 4.6 billion years ago • from fossils to present-day species • 2. Microevolution: • small scale changes in allele frequencies in the gene pool of a population • from mutations to speciation events
Speciation Definition (Ernst Mayr): Species are groups of interbreeding natural populations (which produce fertile offspring) that are reproductively isolated from other such groups. Many/large microevolutionary steps new species Reproductive isolation Gene flow between populations stops = gene pools stay separate Genetic divergence (change) of structural, function, or behavioral traits Reproductive isolation: populations are not longer reproductively compatible = a new species has originated
How is gene flow stopped? • Separation by a physical barrier (created by glaciation, earth quakes, volcanic activity, formation of mountains, land bridges = allopatric speciation • Ecological separation without physical barriers (different food, mating areas) = sympatric speciation
How is gene flow stopped? • Separation by a physical barrier (created by glaciation, earth quakes, volcanic activity, formation of mountains, land bridges = allopatric speciation North American Prairie camelid ancestor landbridges camels Asia, Africa Ilama South America vicuna South America
Stepped Art 1 A few individuals of a species on the mainland reach isolated island 1. Speciation follows genetic divergence in a new habitat. 3 2 4 Later in time, a few individuals of the new species colonize nearby island 2. In this new habitat, speciation follows genetic divergence. 1 2 Speciation may also follow colonization of islands 3 and 4. And it may follow invasion of island by genetically different descendants of the ancestral species. 1 3 2 4 How is gene flow stopped? • Separation by a physical barrier (created by glaciation, earth quakes, volcanic activity, formation of mountains, land bridges = allopatric speciation New islands created by volcanic activity. Fig. 17-20a, p.275
How is gene flow stopped? 2. Ecological separation without physical barriers (different food, mating areas) = sympatric speciation Cichlids in Africa live on different food sources many species in one lake. Fig. 17-21a, p.276
Speciation Definition (Ernst Mayr): Species are groups of interbreeding natural populations (which produce fertile offspring) that are reproductively isolated from other such groups. Many/large microevolutionary steps new species Reproductive isolation Gene flow between populations stops = gene pools stay separate Genetic divergence (change) of structural, function, or behavioral traits Reproductive isolation: populations are not longer reproductively compatible = a new species has originated
Naming species - taxonomy • Scientific name: • Latin • Binomial (2 parts: generic name + species epithet Ursus arctos – brown bear Ursus americanus – black bear common name genus species
Ranking species - classification Ursus arctos – brown bear Ursus americanus – black bear Fig. 17-27, p.280
Trees/dendrograms illustrate relationship between species - phylogeny extinct
Evolutionary Tree of Life The three domain system: Webpage: http://tolweb.org/tree/phylogeny.html p.259c
Evolutionary Tree of Life ANIMALS PLANTS arthropods chordates FUNGI flowering plants conifers annelids roundworms club fungi echinoderms sac fungi ginkgos mollusks cycads horsetails rotifers zygospore- forming fungi ferns flatworms cnidarians lycophytes bryophytes chytrids charophytes sponges chlorophytes amoeboid protozoans PROTISTS choanoflagellates (stramenopiles) brown algae alveolates red algae ciliates chrysophytes apicomplexans oomycotes dinoflagellates “crown” of eukaryotes (rapid divergences) euglenoids slime molds kinetoplatids Parabasalids (e.g., Trichomonas) ARCHAEA BACTERIA spirochetes diplomonads crenarchaeotes euryarchaeotes Gram-positive bacteria chlamydias cyanobacteria korarchaeotes Webpage: http://tolweb.org/tree/phylogeny.html
Phylogenetic trees illustrate the relationship between species. • What type of evidence/support is used to build a tree? • Biochemical evidence • Fossil evidence • Morphological evidence • Developmental evidence Fig. 17-15, p.271
1. Biochemical evidence: DNA, protein, or metabolite analysis DNA example ATGCGCCTTAGCA polar bear TTGCGCCTAAGCA brown bear GTCGGCCTAATCT black bear protein example (cytochrome c needed for respiration): conserved areas between Yeast/wheat/primate Fig. 17-14b, p.271
1. Biochemical evidence: DNA, protein, or metabolite analysis Molecular clock: Time scale of biochemical analysis: when have species diverged from each other? Assumption: neutral mutations happen at a constant rate
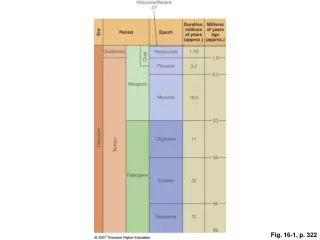
2. Fossil evidence: • Evidence of ancestral species • Evidence for a time scale: • the deepest layer in the ground contains the oldest fossils • radiometric dating p.259b
The deepest layer in the ground contains the oldest fossils Fig. 17-3, p.261
Radiometric Dating Uranium (in rocks) → Lead: the earth is at least 4.6 billion years old after one half-life after two half-lives a A simple way to think about the decay of a radioisotope to a more stable form, as plotted against time. Fig. 17-4a, p.262
Radiometric Dating b Long ago, trace amounts of 14C and a lot more 12C were incorporated into tissues of a living mollusk. The carbon was part of the organic compounds making up the tissues of its prey. As long as it lived, the proportion of 14C to 12C in its tissues remained the same. Fig. 17-4b, p.262
Radiometric Dating c When the mollusk died, it stopped gaining carbon. Over time, proportion of 14C to 12C in its remains declined because of the radioactive decay of 14C. Half of the 14C had decayed in 5,370 years, half of what remained was gone in another 5,370 years, and so on. Fig. 17-4c, p.262
Radiometric Dating dFossil hunters find the fossil. They measure its 14C/12C ratio to determine the half-life reductions since death. The ratio turns out to be one-eighth of the 14C/12C ratio in living organisms. Thus the mollusk lived about 16,000 years ago. Fig. 17-4d, p.262
Midnight, origin of life 11:59:40 PM, first humans origin of prokaryotes dinosuars, flowering plants origin of eukaryotes Fig. 17-6, p.263
Location of fossil records needs to be interpreted in the context of the plate tectonic theory: continents are drifting island arc oceanic crust oceanic ridge trench continental crust lithosphere (solid layer of mantle) hot spot athenosphere (plastic layer of mantle) subducting plate Fig. 17-7b, p.264
Location of fossil records needs to be interpreted in the context of the plate tectonic theory: continents are drifting a 420 mya b 260 mya c 65 mya d 10 mya PANGEA supercontinent Fig. 17-8a, p.265
NORTH AMERICAN PLATE EURASIAN PLATE PACIFIC PLATE PHILIPPINE PLATE COCOS PLATE SOMALI PLATE SOUTH AMERICAN PLATE NAZCA PLATE INDO- AUSTRALIAN PLATE AFRICAN PLATE ANTARCTIC PLATE Fig. 17-7a, p.264
3. Morphological evidence: Fig. 17-30, p.281
3. Morphological evidence: HOMOLOGIES give useful information about relationship: Homology = similar structure (bone, muscle, nerve, …) inherited from a common ancestor ANALOGIES should not be used to infer relationship: Analogy = structure that seems to be similar but has not been inherited from a common ancestor Fig. 17-9a, p.266
Homology = similar structure (bone, muscle, nerve, …) inherited from a common ancestor Example: comparison of forelimbs Fig. 17-9, p.266
Analogy = structure that seems to be similar but has not been inherited from a common ancestor Example: comparison of wings skin extension of exoskeleton (chitin) feathers Fig. 17-10a, p.267
body wall (exoskeleton) strong membrane (extension of wall) wing veins Fig. 17-10d, p.267
4. Developmental evidence: Similarities may be obvious only during the early stages of development, not in the adult individual: chimpanzee skull proportions in infant adult human skull Fig. 17-12a, p.268