Download
1 / 12
130 likes | 486 Views
The Best-Fit Line. Linear Regression. How do you determine the best-fit line through data points?. Fortunately technology, such as the graphing calculator and Excel, can do a better job than your eye and a ruler!. y-variable. x-variable. The Equation of a Straight Line. y = mx + b

E N D
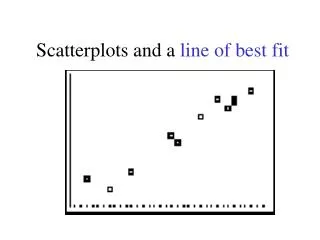
The Best-Fit Line Linear Regression
How do you determine the best-fit line through data points? Fortunately technology, such as the graphing calculator and Excel, can do a better job than your eye and a ruler! y-variable x-variable
The Equation of a Straight Line y = mx + b where m is the slope or Dy/Dx and b is the y-intercept In some physical settings, b = 0 so the equation simplifies to: y = mx
Linear regression minimizes the sum of the squared deviations y = mx + b y-variable deviation = residual = ydata point – yequation x-variable
Linear Regression • Minimizes the sum of the square of the deviations for all the points and the best-fit line • Judge the goodness of fit with r2 • r2 x100 tells you the percent of the variation of the y-variable that is explained by the variation of the x-variable (a perfect fit has r2 = 1)
r2 is low r2 is high Goodness of Fit: Using r2 y-variable How about the value of r2? x-variable
Strong direct relationship 99.1% of the y-variation is due to the variation of the x-variable
Noisy indirect relationship Only 82% of the y-variation is due to the variation of the x-variable - what is the other 18% caused by?
When there is no trend! No relationship!
In Excel • When the chart is active, go to chart, and select Add Trendline, choose the type and on option select display equation and display r2 • For calibration curves, select the set intercept = 0 option Does this make physical sense?
Does the set intercept = 0 option make a difference? Using the set intercept = 0 option lowers the r2 value by a small amount and changes the slope slightly
The equation becomes A = mc or A = 0.89c 99.1% of the variation of the absorbance is due to the variation of the concentration.