Download
1 / 12
120 likes | 554 Views
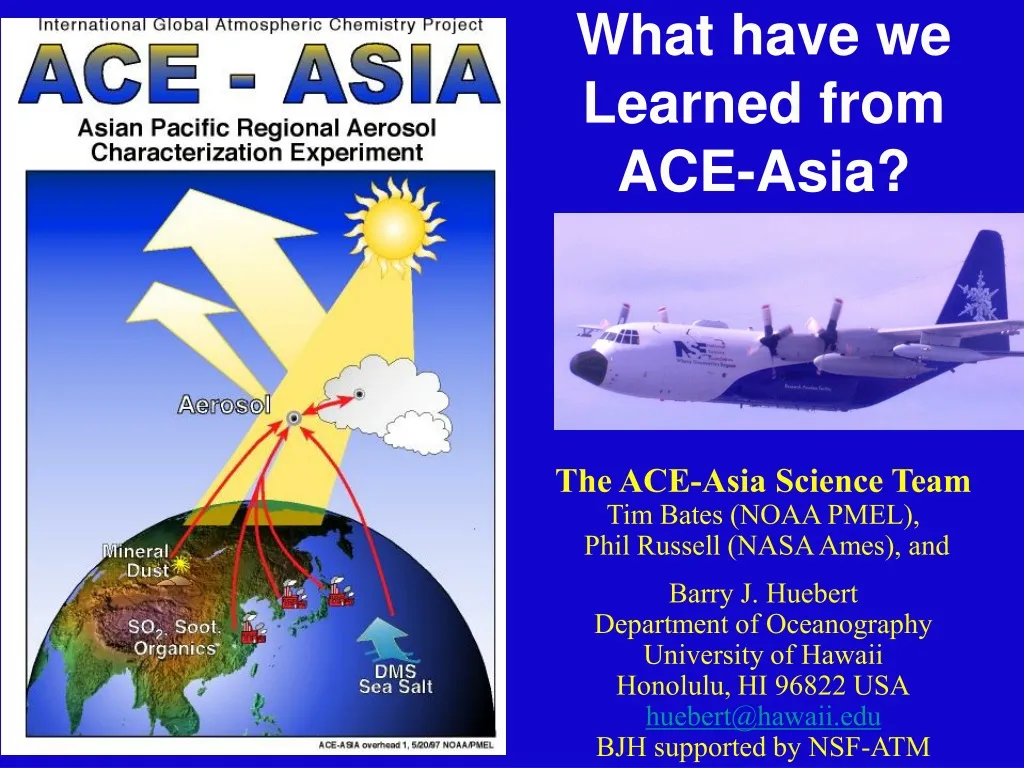
What have we Learned from ACE-Asia?. The ACE-Asia Science Team Tim Bates (NOAA PMEL), Phil Russell (NASA Ames), and Barry J. Huebert Department of Oceanography University of Hawaii Honolulu, HI 96822 USA huebert@hawaii.edu BJH supported by NSF-ATM. What have we learned from ACE-Asia?

E N D
What have we Learned from ACE-Asia? The ACE-Asia Science Team Tim Bates (NOAA PMEL), Phil Russell (NASA Ames), and Barry J. Huebert Department of Oceanography University of Hawaii Honolulu, HI 96822 USA huebert@hawaii.edu BJH supported by NSF-ATM
What have we learned from ACE-Asia? Air pollution changes dust aerosols in many ways, adding black carbon, toxic materials, and acidic gases to the mineral particles. These change its impact on health, climate, and the delivery of nutrient iron to the remote Pacific ocean. The dust that goes from East Asia to the Pacific does not absorb nearly as much light as the dark aerosol from South Asia or some previous Saharan dust data. There are dramatic regional differences in the optical properties of aerosols. Combining ACE-Asia suborbital and satellite measurements yields monthly average (April 2001), cloud-free aerosol radiative forcing at the surface in ACE-Asia exceeding -30 W m-2 in a plume downwind of Japan and in the Yellow Sea, East China Sea, and Sea of Japan. B.Huebert, ACE-Asia, 12/02
B. Huebert, ACE-Asia, 12/2002 Observations by all these platforms were coordinated to connect surface and profile measurements. Korean Kosan NSF/NCAR C-130 Photo: A. Clarke Photo: B. Huebert Navy/CIRPAS Twin Otter NOAA R/V Ron Brown Photo: B. Huebert Photo: T. Bates
Dust acts like a sponge, soaking up pollutant gases and aerosols. It can then transport these materials to other continents. These SEM micrographs by Jim Anderson (ASU) show the way soot balls (pollution) coat mineral dust particles Many different forms of soot stuck on a particle of quartz (SiO2). Complex aggregate of soot, mineral particles (upper), and a non-soot carbonaceous particle. B. Huebert, ACE-Asia, 12/2002
In April, 2001, the dust cloud from a Chinese storm passed over the Midwest, over NE US, and across the Atlantic to the Azores. This Chinese dust storm had such a large impact on visibility in Colorado that it was featured in national newscasts. GOES8 (East) view of dust streak on the evening of Friday 13th From: http://capita.wustl.edu/AsiaDust0104/reports/ThePerfectStorm.htm B. Huebert, ACE-Asia, 12/2002
SO2 and Scattering Profiles D D Not all layers are the same: some dust layers are more modified by pollution than others. SO2 and dust co-exist from 4-5 km, but dust has scavenged all SO2 from the 3-4 km layer. C-130 sounding over Yellow Sea Blue = Total Scatt Green= <1um Scatt Red = SO2 D D P P P Courtesy of Blomquist, UH; Bandy, Drexel; Masonis & Anderson, U. Washington B. Huebert, ACE-Asia, 12/2002
Light absorbed by aerosols is also highly variable regionally. Unpolluted dust does not absorb much. Asian pollution is much blacker than North American. Courtesy P. Quinn (NOAA-PMEL) and S. Masonis (UW) This absorption warms layers of the air, potentially inhibiting rainfall in places. This has implications for agriculture, fire suppression, and many other issues. B.Huebert, ACE-Asia, 12/02
Combining ACE-Asia suborbital and satellite measurements yields monthly average (April 2001), cloud-free aerosol regional direct radiative forcing at the surface in ACE-Asia exceeding -30 W m-2 (strong cooling!) in a plume downwind of Japan and in the Yellow Sea, East China Sea, and Sea of Japan. By contrast, warming by all greenhouse gases is +3 W m-2. However, recall that this aerosol cooling is regional, while the warming is global. Several optical properties of aerosols are needed to calculate this direct radiative forcing. They are very different in air exiting East Asia for the Pacific than in other locations. B.Huebert, ACE-Asia, 12/02
AOD can be derived from satellites (although they only see radiation emerging from the top of the atmosphere, TOA) Energy changes differ for surface, TOA, and absorbing layers. B.Huebert, ACE-Asia 12/02
Combining the SeaWiFS data and ACE-Asia in situ aerosol optical properties allows us to estimate the direct surface aerosol forcing: about -30 w/m2, large and negative (cooling) However, absorption causes atmospheric warming ! B.Huebert, ACE-Asia, 12/02
What does this mean to general public? We can observe "dust" transport half way around the globe by satellite. However it is not just dust, it is dust mixed with pollution.We have to think of atmospheric chemistry and its impact on air quality and climate change as global issues. We can not measure dust in one region and assume that dust everywhere around the Earth will have the same impacts on climate. Dust and pollution aerosol properties vary regionally. The regional net surface cooling effect of aerosols downwind of Asia (-30 w/m2) is much higher (by 10x) than the TOA warming by greenhouse gases. The climatic impact of this cooling is still being assessed. ACE-Asia data is publicly available at http://saga.pmel.noaa.gov/aceasia/ huebert@hawaii.edu B.Huebert, ACE-Asia, 12/02
Funding Agencies - THANKS!! Australia ARC - Australian Research Council COSSA - CSIRO Office of Space Science Applications CoA-MNRF Program (Major National Research facilities of the Commonwealth of Australia) Australian Government Analytical Laboratories China Institute of Earth Environment, Xian Institute of Atmospheric Physics, Beijing Chinese Natural National Science Foundation Chinese Academy of Sciences State Science & Technology Committee Chinese Taipei Academia Sinica, Environmental Change Research Project (ECRP) National Science Council, NSC France CNRS/INSU/PNCA (Programme National Chimie Atmosphérique) Japan Japan Science & Technology Corporation (JST) National Space Development Agency of Japan (NASDA)/ADEOS-II satellite program University of Kyoto, Graduate School of the Environment Core Research for Environmental Science and Technology (CREST) Ministry of Education, Science, Sports and Culture of Japan Korea Korea Science and Engineering Foundation Korean Meteorological Administration UK Natural Environment Research Council USNSF Atmospheric Chemistry Program NSF Atmospheric Sciences Facilities NOAA OGP – Aerosol Project NOAA OAR ONR NSF Large Scale Dynamic Meteorology Program NSF Climate Dynamics Program NASA SIMBIOS Project NASA Radiation Program NASA Global Aerosol Climatology Project NASA CERES (EOS) NASA ACMAP DOE Atmospheric Chemistry Program DOE ARM University of California Pacific Rim Program Photo: B. Huebert, Asian aerosols color a sunset over the Pacific B. Huebert, ACE-Asia, 12/2002


