Download
1 / 31
310 likes | 587 Views
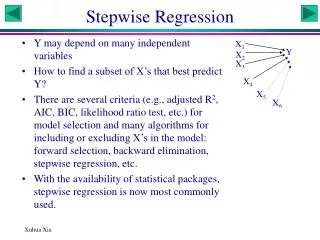
A stepwise procedure for conditional testing of GO term overrepresentation Constantin Georgescu . The human genome. The whole hereditary information of an organism: Instructions providing all the information necessary for a living organism to grow and live

E N D
A stepwise procedure for conditional testing of GO term overrepresentation Constantin Georgescu
The human genome • The whole hereditary information of an organism: Instructions providing all the information necessary for a living organism to grow and live • Instructions encoded in the form of DNA molecules. DNA encodes a detailed set of plans, like a blueprint, for building different parts of a cell. • Reside in the nucleolus of every cell, on 23 pairs of chromosomes • DNA molecule forms a double helix, a string built with the four-letter DNA alphabet A,C,T,G DNA strand made of letters that make words that make sentences called “genes”. • Genes: segment of chromosomal DNA that encode and direct the synthesis of a protein; proteins carrying out most cellular functions • Sequenced by 2003; 2 meters of DNA; 3 bil bp; 25000 genes; • 97% junk DNA
Differential expression • Cells: the fundamental working units of every living organism. • Each cell contains a complete copy of the organism's genome. • Cells are of many different types and states E.g. Blood, nerve, and skin cells, dividing cells, cancerous cells, etc. • What makes the cells different? • Differential gene expression, i.e., when, where, and how much each gene is expressed. • On average, 40% of our genes are expressed at any given time.
Central dogma • The expression of the genetic information stored in the DNA molecule occurs in two stages: – (i) transcription, during which DNA is transcribed into mRNA; – (ii) translation, during which mRNA is translated to produce a protein. DNA->mRNA->protein • Other important aspects of gene regulation: methylation, alternative splicing, etc.
Examining Gene Expression • Understanding the functions of genes depends on knowing when and in what cells they are each expressed. • microarray chip (developed in late 1990) allow examining the expression of thousands of genes simultaneously • microarray chips are glass slides spotted with many rows containing tiny amounts of probe DNA, one for each of thousands of genes • measure the amount of mRNA transcribed from a gene in a particular cell type through complementary binding • rapid and sensitive tests, in a variety of experimental studies on different cell types : cancer cells versus normal cells, or liver cells versus kidney cells, etc
A RNA is isolated from cells from two samples (in this illustration, infected and uninfected plant cells). B. The mRNA from both samples is copied to a more stable form, called cDNA, using reverse transcriptase. C. At the same time, the cDNA is labeled with fluorescent tags (a different color tag for each sample). D. The tagged cDNA is placed on the microarray chip, where it binds to the corresponding DNA that makes up the genes that have been previously spotted on the chip. E. The chip is placed in a laser scanner, which identifies the genes that hybridize to each sample (uninfected=green; infected=red; and both samples=yellow). F. The data are displayed on a computer screen where expression of the individual genes can be identified.
Combining data across slides Data on G genes for n hybridizations results in a Gxn gene-by-array data matrix Array1 Array2 Array3 Array4 Array5 … Gene1 0.46 0.30 0.80 1.51 0.90 ... Gene2 -0.10 0.49 0.24 0.06 0.46 ... Gene3 0.15 0.74 0.04 0.10 0.20 ... Gene4 -0.45 -1.03 -0.79 -0.56 -0.32 ... Gene5 -0.06 1.06 1.35 1.09 -1.09 ... … … … … … … ... Preprocessing->normalization->summarization->testing=> List of differentially expressed genes
Gene Groups • Challenge: go from sequence to function, i.e., define the role of each gene and understand how the genome functions as a whole. • The complete genome sequence doesn’t tell us much about how the organism functions as a biological system. • We need to study how different gene products interact to produce various components. • Most important activities are not the result of a single molecule but depend on the coordinated effects of multiple molecules.
Gene Ontology • Common set of terms and descriptions for basic biological functions, processes and entities. (Mechanism for representing a communities domain knowledge in aform accessible by human and amenable to computation) • GO provides a restricted vocabulary and clear description of the relationships between terms. • Gene Ontology consortium produce 3 independent ontologies: -Biological Process: “biological objective to which the gene product contribute”; accomplished via one or more ordered assembiles of molecular functions. Ex: cell growth; signal transduction “almost a pathway” -Molecular Function: “biochemical activity or action of the gene product”, EX:”enzime”, ”transporter”,”ligand” -Cellular Component: component of a cell that is part of some larger object or structure; Ex: chromosome, nucleus, ribosome
Gene Ontology • Organized as a DAG with many to many relationships; • Children terms are more specific that their parents • Is a/has a relationships • Mapping of genes to GO terms carried out separately (ex chip meta-data, GOA); • Mapping as specific as possible; • Propagation up through hierarchy • “Across dependences”: one gene mapped to several GO terms
Gene set analysis Given: • a directed acyclic graph (GO graph) and a set of items (genes) s.t.: – each node in the graph contains some genes – the parent of a node contains all the genes of its child – a node can contain genes that are not found in the children • a subset of genes that we call significant genes (differentially expressed genes) Goal: • find the nodes from the graph (biological functions) that best represent the significant genes w.r.t some scoring function (some test statistic) Over-representation analysis (ORA): is based on Fisher (hypergeometric) test -Most popular method: easy; exact; works for small sets; stability -implemented in GOstats, OntoExpress, GOMiner, Ontologizer, FatiGO, MAPPfinder …
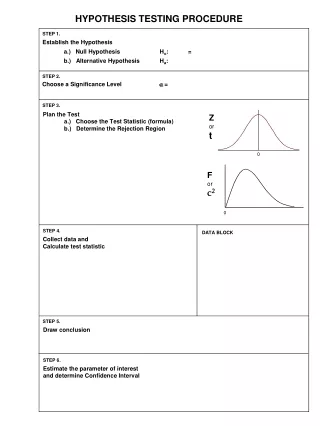
Fisher’s exact test The score for a GO term is the degree of independence between the two properties: A = {gene is in the list of significant genes} B = {gene is found in the GO term}. • Testing the independence of two groups in the above contingency table corresponds to Fisher’s exact test [Khatri and Draghici, 2005]
Fisher’s exact test This is the probability of getting exactly x by chance (not what we want) For computing the significance of a gene set, we can use a hypergeometric test: • N genes are on microarray • Bio is a GO term – M genes in Bio – N −M genes not in Bio • Let K be the no. of significant genes • What is the probability of having exactly x genes from K of type Bio ?
Parent-Child method • What is the proper N ? • x=10, M=400, K=40 N=1000 => pval=0.98 N=5000 => pval=0.0009145082 • Need unspecific prefiltering (remove genes not expressed in any sample) • Remove genes not present in any GO terms • Parent-Child method (Grossmann) proposes N=nb. genes in the parent of current GO term
Complex test dependence • Gene annotations propagate through DAG • Gene annotated to multiple unrelated GO terms (across dependence) • Implicit propagation of GO term significance • No reasonable pvalue correction mehtod available
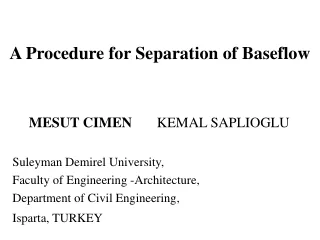
Elim method The main idea: Test how enriched node x is if we do not consider the genes from its significant children (Alexa A. 2006) • The nodes are processed bottom-up. This assures that all children of node x were investigated before node x itself. • The p-value for node x is computed using Fisher’s exact test. • If node x is found significant, remove all the genes mapped to this node, from all its ancestors. • Elimw –use some heuristic to ease gene removal • Essentially Parent-Child method at the other end of DAG
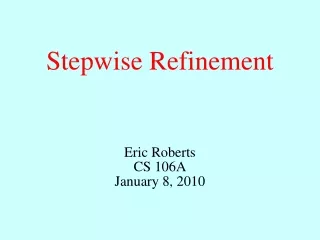
Step method • First attempt: do both. Good ordering but (very) little test power • Need to reduce conditioning as much as possible (to recover test power) =>stepwise feature selection • Asymptotically Hypergeometric test binomialnormalchi-squareratio likelihood (information criteria test) • Feature selection uses AIC/BIC=f(information criteria) AIC=IC-d; BIC=IC-d*log(N)/2 • Translate BIC back in terms of hypergeometric => Fisher test with adaptive pvalue treshold • Develop close form solutions specific to this particular situation for diffrence in deviances of two models
Step methods • Reduces to Parent-Child /elim for nodes on bottom/top of the DAG GO • Adaptive threshold: no need to choose a cutoff for the p-value • Results in independent tests (makes value correction methods valid) • Developed in terms of hypergeometric test: fast, applicable on small GO terms
Simulation results 1000 iterations; 3 nodes enriched 1/20 vs 1/100 tpr fpr tsel sel enriched nodes 1.000 0.000 3000 3000 sigN 0.063 0.936 2832 44696 sigNc 0.078 0.921 1036 13237 Grossman 0.110 0.889 2034 18416 selGlobGO 0.608 0.391 1262 2073 selectsGOi 0.516 0.483 1252 2422 selectsGOi2 0.289 0.710 1441 4978 selectsGOih 0.472 0.527 1261 2669
-Use of Affymetrix U133 gene arrays, -Explored the APC-induced gene expression in the lung of baboons challenged with lethal doses of E. coli at 8 hrs. Expression pattern and biological significance of the differentially expressed genes were explored using Gene Ontology (GO) and pathway analysis. -6 samples (3 control 3 lethal E coli) -8700 expressed genes -294 diff expressed genes (at 0.01 FDR) -44 BP GO terms (<0.01) GOBPID mark Term GO:0009607 10 response to biotic stimulus GO:0010038 8 response to metal ion GO:0006508 9 proteolysis GO:0045185 maintenance of protein localization GO:0019363 pyridine nucleotide biosynthesis GO:0042327 8 positive regulation of phosphorylation GO:0008624 10 induction of apoptosis by extracellular signals
Significant GO terms with Step GOBPID Pvalue ExpCount Count Size Term markGO pvlw W pvlGsm G pvlGlb S pvlGih I GO:0009607 0.0000 16.0550 39 519 response to biotic stimulus 10 1.0000 0 0.0002 1 0.0000 1 0.0000 1 GO:0010038 0.0090 0.1547 2 5 response to metal ion 8 0.0090 1 0.4762 0 0.0047 1 0.0053 1 GO:0006508 0.0012 9.4969 20 307 proteolysis 9 0.0890 0 0.0012 1 0.0008 1 0.0014 1 GO:0045185 0.0040 0.3403 3 11 maintenance of protein localization 0 1.0000 0 0.0084 1 0.0008 1 0.0010 1 GO:0019363 0.0055 0.1237 2 4 pyridine nucleotide biosynthesis 0 0.0055 1 0.0084 1 0.0029 1 0.0032 1 GO:0042327 0.0180 0.2165 2 7 positive regulation of phosphorylation 8 0.1448 0 0.2000 0 0.0015 1 0.0016 1 GO:0008624 0.0291 0.6806 3 22 induction of apoptosis by extracellular signals 10 0.0291 0 0.0307 0 0.0059 1 0.0069 1 GO:0009607` response to biotic stimulus "A change in state or activity of a cell or an organism (in terms of movement, secretion, enzyme production, gene expression, etc.) as a result of a biotic stimulus, a stimulus caused or produced by a living organism." `GO:0010038` response to metal ion "A change in state or activity of a cell or an organism (in terms of movement, secretion, enzyme production, gene expression, etc.) as a result of a metal ion stimulus." `GO:0006508` proteolysis "The hydrolysis of a peptide bond or bonds within a protein." `GO:0045185` maintenance of protein localization "The processes by which a protein is maintained in a location and prevented from moving elsewhere. These include sequestration, stabilization to prevent transport elsewhere and the active retrieval of proteins that do move away." `GO:0019363` pyridine nucleotide biosynthesis "The chemical reactions and pathways resulting in the formation of a pyridine nucleotide, a nucleotide characterized by a pyridine derivative as a nitrogen base." `GO:0042327` positive regulation of phosphorylation "Any process that activates or increases the frequency, rate or extent of addition of phosphoric groups to a molecule." `GO:0008624` induction of apoptosis by extracellular signals "Any process induced by extracellular signals that directly activates any of the steps required for cell death by apoptosis."
GOBPID Term mark I GO:0030218 erythrocyte differentiation 3 0 GO:0030099 myeloid cell differentiation 9 0 GO:0006857 oligopeptide transport 4 0 GO:0015833 peptide transport 0 0 GO:0045185 maintenance of protein localization 0 1 GO:0006621 protein retention in ER 5 0 GO:0019363 pyridine nucleotide biosynthesis 0 1 GO:0007259 JAK-STAT cascade 10 0 GO:0018108 peptidyl-tyrosine phosphorylation 0 0 GO:0042327 positive regulation of phosphorylation 8 1 GO:0008624 induction apoptosis by extcell signals 10 1 GOBPID Term GO:0006508 proteolysis GO:0006511 ubiquitin-dependent protein catabolism GO:0006568 tryptophan metabolism GO:0006569 tryptophan catabolism GO:0006576 biogenic amine metabolism GO:0006586 indolalkylamine metabolism GO:0006725 aromatic compound metabolism GO:0009056 catabolism GO:0009072 aromatic amino acid family metabolism GO:0009074 aromatic amino acid family catabolism GO:0019439 aromatic compound catabolism GO:0019941 modification-dependent protein catabolism GO:0030163 protein catabolism GO:0042219 amino acid derivative catabolism GO:0042402 biogenic amine catabolism GO:0042430 indole and derivative metabolism GO:0042434 indole derivative metabolism GO:0042436 indole derivative catabolism GO:0043285 biopolymer catabolism GO:0043632 modification-dependent macromlc catabolism GO:0046218 indolalkylamine catabolism
The acute lymphoblast leukemia (ALL) microarray dataset of Chiaretti et al. (2004) Differential gene expression between B-cell ALL with the BCR/ABL (37 samples) fusion and cytogenetically normal NEG B-cell (42 samples) ALL The BCR/ABL fusion (Dudoit 2006) A number of recent articles have investigated the prognostic relevance of the BCR/ABL fusion in adult ALL of the B-cell lineage (Gleissner et al., 2002). The BCR/ABL fusion is the molecular analogue of the Philadelphia chromosome, one of the most frequent cytogenetic abnormalities in human leukemias. This t(9;22) translocation leads to a head-to-tail fusion of the v-abl Abelson murine leukemia viral oncogene homolog 1 (ABL1) from chromosome 9 with the 5’ half of the breakpoint cluster region (BCR) on chromosome 22 (Figure 4). The ABL1 proto-oncogene encodes a cytoplasmic and nuclear protein tyrosine kinase that has been implicated in processes of cell differentiation, cell division, cell adhesion, and stress response. Although the BCR/ABL fusion protein, encoded by sequences from both the ABL1 and BCR genes, has been extensively studied, the function of the normal product of the BCR gene is not clear. The BCR/ABL proto-oncogene has been found to be highly-expressed in chronic myeloid leukemia (CML) and acute myeloid leukemia (AML) cells (Mukhopadhyay et al., 2002). (See Figure 4 in Dudoit paper)
$`GO:0007155` cell adhesion The attachment of a cell, either to another cell or to an underlying substrate such as the extracellular matrix, via cell adhesion molecules. $`GO:0007154` cell communication Any process that mediates interactions between a cell and its surroundings. Encompasses interactions such as signaling or attachment between one cell and another cell, between a cell and an extracellular matrix, or between a cell and any other aspect of its environment. $`GO:0008283` cell proliferation The multiplication or reproduction of cells, resulting in the rapid expansion of a cell population. $`GO:0007165` signal transduction The cascade of processes by which a signal interacts with a receptor, causing a change in the level or activity of a second messenger or other downstream target, and ultimately effecting a change in the functioning of the cell. $`GO:0007166` cell surface receptor linked signal transduction Any series of molecular signals initiated by the binding of an extracellular ligand to a receptor on the surface of the target cell.
BCR vs NEG, ALL file GOBPID Pvalue ExpCount Count Size Term pvlw W pvlGsm G pvlGlb S pvlGih Ih GO:0007155 0.0000 6.8198 19 114 cell adhesion 0.0002 1 0.0000 1 0.0114 1 0.0002 1 GO:0008283 0.0856 11.1271 16 186 cell proliferation 0.2002 0 0.0382 0 0.0012 1 0.0032 1 GO:0007154 0.0001 42.4743 65 710 cell communication 0.0153 0 0.0000 1 0.0000 1 0.0000 1 GO:0007165 0.0002 40.4404 61 676 signal transduction 0.3324 0 0.8081 0 0.7354 0 0.9084 0 GO:0007166 0.0006 12.7423 25 213 cell surface receptor linked signal transduction 0.5743 0 0.0656 0 0.7487 0 0.6235 0 GO:0043067 0.0093 8.4949 16 142 regulation of programmed cell death 1.0000 0 0.0080 1 0.1348 0 0.1414 0 GO:0042981 0.0093 8.4949 16 142 regulation of apoptosis 0.3622 0 0.1605 0 0.1348 0 0.1414 0 GO:0048519 0.0021 17.7076 30 296 negative regulation of biological process 1.0000 0 0.0033 1 0.1178 0 0.0703 0 GO:0043118 0.0023 16.2120 28 271 negative regulation of physiological process 0.4735 0 0.0014 1 0.2156 0 0.1252 0 GO:0051243 0.0041 16.0924 27 269 negative regulation of cellular physiological process 0.2914 0 0.0025 1 0.2096 0 0.1211 0 GO:0048523 0.0083 16.9299 27 283 negative regulation of cellular process 0.6374 0 0.0166 0 0.2096 0 0.1211 0 GO:0009653 0.0005 8.4350 19 141 morphogenesis 1.0000 0 0.0613 0 0.1760 0 0.0105 0 GO:0007275 0.0008 21.4166 36 358 development 0.8927 0 0.0008 1 0.0055 1 0.0069 0 GO:0000902 0.0019 4.6662 12 78 cellular morphogenesis 0.6335 0 0.0038 1 0.1496 0 0.0215 0 GO:0007420 0.0019 0.2991 3 5 brain development 0.0019 1 0.0103 0 0.0350 0 0.0099 0 GO:0048731 0.0025 4.1876 11 70 system development 1.0000 0 0.0672 0 0.2145 0 0.0241 0 GO:0007399 0.0025 4.1876 11 70 nervous system development 0.3264 0 1.0000 0 0.2145 0 0.0241 0 GO:0031175 0.0042 0.7179 4 12 neurite development 1.0000 0 0.4945 0 0.2947 0 0.1582 0 GO:0009887 0.0051 2.7519 8 46 organ morphogenesis 0.0082 1 0.1553 0 0.0666 0 0.0084 0 GO:0048513 0.0066 7.4779 15 125 organ development 0.8719 0 0.2363 0 0.1892 0 0.0115 0 GO:0048468 0.0067 1.2563 5 21 cell development 1.0000 0 0.0443 0 0.1343 0 0.0416 0 GO:0048666 0.0077 0.8375 4 14 neuron development 1.0000 0 0.3801 0 0.2947 0 0.1582 0 GO:0007611 0.0036 0.1196 2 2 learning and/or memory 0.0036 1 0.0077 1 1.0000 0 1.0000 0 GO:0030036 0.0097 3.0510 8 51 actin cytoskeleton organization and biogenesis 0.0073 1 0.7184 0 0.0680 0 0.1294 0 -disagreement about including or not development -cell proliferation not significant initially, very significant after conditioning
REFERENCES • http://www.learner.org/channel/courses/biology/support/1_genom.pdf • Tarca AL, Romero R, Draghici S. Analysis of microarray experiments of gene expression profiling. American Journal of Obstetrics and Gynecology 195(2):373-388, August 2006 • Purvesh Khatri and Sorin Draghici. Ontological analysis of gene expression data: current tools, limitations, and open problems. Bioinformatics, 21(18):3587-95, September 2005 • A. Alexa et al. Improved scoring of functional groups from gene expression data by decorrelating GO graph structure, Bioinformatics, 13, 2006 • Grossmann, S., Bauer, S., Robinson, P.N., Vingron, M. (2006) An improved statistic for detecting over-represented Gene Ontology annotations in gene sets. Proceedings of the Lecture Notes in Computer Science 3909 , pp. 85–98 March 2006. • Drăghici, S. et al. (2003) Onto-Tools, the toolkit of the modern biologist: Onto-Express, Onto-Compare, Onto-Design and Onto-Translate. Nucleic Acids Res., 31, 3775–3781. • 7S. Falcon, R. Gentleman Using GOstats to test genes lists for GO term association, Bioinformatics, Jan 15, 2007, 23 • H. Zhu et all. (2007) Genomic and structural analysis of the protective effects of activated protein C in a baboon model of E. Coli sepsis. ISTH 2007 Congress • Chiaretti, S., et al. (2004) Gene expression profile of adult T-cell acute lymphocytic leukemia identifies distinct subsets of patients with different response to therapy and survival. Blood, 103, 2771–2778 • Dudoit S. Multiple Tests of Association with Biological Annotation Metadata