Download
1 / 43
430 likes | 648 Views
European PHOENICS User Meeting November 30 th to December 1 st , 2006 Wimbledon, London. The Application of CFD to the Estimation of Motor Vehicle Pollution in Urban Environments. Prof. John M. Crowther School of the Built & Natural Environment Glasgow Caledonian University.

E N D
European PHOENICS User Meeting November 30th to December 1st, 2006 Wimbledon, London The Application of CFD to the Estimation of Motor Vehicle Pollution in Urban Environments Prof. John M. Crowther School of the Built & Natural Environment Glasgow Caledonian University
Topics to be covered • Introduction • Rationale for air quality modelling • Main pollutants and their health effects • Advection/diffusion models • Two-dimensional CFD models • Three-dimensional CFD models • Conclusions
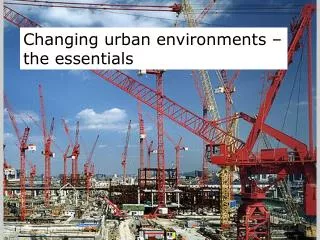
Introduction • Polluted air can adversely affect humans, plants, animals and buildings. • Major pollution events can cause illness and death • Chronic pollution, even at low levels can cause and exacerbate respiratory illness. • Pollution may arise from industry, domestic and commercial heating, agriculture and transport. • Major problems are now being created by motor vehicles, despite technological improvements.
Rationale for Air Quality Modelling • Establishing emission control legislation • Evaluating emission control strategies • Locating future sources • Planning control of pollution episodes • Assessing responsibility for pollution • Spatial and temporal interpolation of data
Carbon monoxide Sulphur dioxide Nitrogen dioxide Particulate Matter Lead Benzene 1,3-butadiene Heavy metals (Hg, Cd, Ni, Cr) Arsenic Poly-aromatic hydrocarbons (PAH) Ozone Peroxyacetyl nitrate (PAN) Main Air Pollutants
Air Pollution Targets the Eyes, Respiratory System and Nervous System
Carbon monoxide • Caused by incomplete combustion of carbon in the fuel • Internal Combustion engine is primary source in urban areas • Combines with haemoglobin in the blood and affects nervous system • Relatively long lifetime in atmosphere: 50 days • Effectively a conserved tracer
Air Quality Models • Air quality models attempt to simulate the concentrations of air pollutants in the real world. • Mathematical models use analytical and numerical formulations, usually implemented on computers. • Models may be deterministic or statistical. • Models may be based on first principles or be empirical.
Eulerian Advection/Diffusion Models • Wind speeds and concentrations are specified in a stationary co-ordinate system (i.e. as “fields”) • Wind speed field is found using computational fluid dynamics (PHOENICS CFD or from measurements) • Advection diffusion equation solved for concentration field.
Advection Diffusion Equation (e.g. in PHOENICS) C(x,y,z,t) = concentration of pollutant KD(x,y,z,t) = atmospheric turbulent diffusion coefficient U(x,y,z,t) = windspeed vector S(x,y,z,t) = source/sink for pollutant = gradient operator 2 = Laplacian operator
PHOENICS CFD Modelling • Two-dimensional, infinitely long street canyon • Cartesian coordinates • Standard k- turbulence model • Steady State
Wind Rose for Meteorological Office Weather Station at Bishopton
Typical Wind Speed Distribution for Bishopton Weather Station
Standard k- Turbulence Model k=1.0, =1.314, C1=1.44, C2=1.92, C= 0.09
PHOENICS two-dimensional simulated wind flow in a street canyon for W=30 m H=20 m
PHOENICS two-dimensional simulated wind flow in a street canyon for W=40 m, H=5 m
PHOENICS CO contours (ppm) for a wind speed above building U=5 m s-1, W=30 m H=20 m
PHOENICS CO contours (ppm) for a wind speed above building U=5 m s-1, W=40 m, H=5 m
Comparison between predicted and measured CO for leeward face of upwind building, Hope Street, Glasgow
Comparison between predicted and measured CO for wind-ward face of downwind building, Hope Street, Glasgow
Traffic Simulation • SATURN: Simulation and Assignment of Traffic in Urban Road Networks • Network analysis software developed by the Institute of Transport Studies, University of Leeds • Commercial Distributor, W S Atkins of Epsom, UK, from 1981
Hourly Averaged Carbon Monoxide Concentrations for Fixed Monitors
PHOENICS CFD, 3-D Modelling • Cartesian coordinates • Renormalisation Group (RNG) k- turbulence model • PARSOL Algorithm (Partial Solution) • Linearisation of minor irregularities in street directions • Rotation of axes to align with streets
RNG k- Turbulence Model o= 4.38, = 0.012 k=0.7914, =0.7914, C1=1.42, C2=1.68, C= 0.0845
Typical CO Conc. Field, Red=High Blue=Low
Conclusions of Glasgow Study • Predicted and measured CO concentrations are in reasonably good agreement, with average errors of 20 to 30 percent • Ideally monitoring stations should be in regions of small concentration gradients, otherwise comparison may be difficult • CFD models can form the basis of an integrated air quality management tool
Existing UK Air Quality Models • R-91, R-157 (Gaussian Plume Models from UK Atmospheric Dispersion Modelling Working Group) • ADMS (CERC commercial code, taking account of vertical profiles of windspeed and turbulence and with integral plume rise model) • ADMS Urban (CERC development including mobile sources and complex topography)
General Conclusions • Large variety of model types and packages. • Choose simplest for the purpose! • Models need to be calibrated and validated. • Accuracy of models may be limited (perhaps to within only a factor of 2!) • CFD models may soon displace simpler Gaussian plume models!
References • A A Hassan & J M Crowther, Env. Mon. & Assessment, 52, 281-297, 1998 • J M Crowther & A A Hassan, Water, Air & Soil Pollution: Focus 2, 279-295, 2002 • D Mumovic, J M Crowther & Z Stevanovic, Building & Environment, 41, 1703-1712, 2006
Acknowledgements • Prof. S M Fraser, Dept. of Mechanical Engineering, University of Strathclyde. • Dr. A. A. Hassan, South Valley University, Qena, Egypt. • Dr. D. Mumovic, The Bartlett, University College London.