Download
1 / 75
750 likes | 1.1k Views
IPAM Intelligent Extraction of Information from Graphs & High Dimensional Data July 26, 2005. Random Dot Product Graphs. Ed Scheinerman Applied Mathematics & Statistics Johns Hopkins University. Coconspirators. Libby Beer John Conroy (IDA) Paul Hand (Columbia) Miro Kraetzl (DSTO)

E N D
IPAM Intelligent Extraction of Information from Graphs & High Dimensional Data July 26, 2005 Random Dot Product Graphs Ed Scheinerman Applied Mathematics & Statistics Johns Hopkins University
Coconspirators • Libby Beer • John Conroy (IDA) • Paul Hand (Columbia) • Miro Kraetzl (DSTO) • Christine Nickel • Carey Priebe • Kim Tucker • Stephen Young (Georgia Tech)
Overview • Mathematical context • Modeling networks • Random dot product model • The inverse problem
Graphs I Have Loved • Interval graphs & intersection graphs • Random graphs • Random intersection graphs • Threshold graphs & dot product graphs
Intersection Graphs {1} {1} {1,2} {2}
Random Graphs Erdös-Rényi style… p 1 – p Randomness is “in” the edges. Vertices are “dumb” placeholders.
Random Intersection Graphs • Assign random sets to vertices. • Two vertices are adjacent iff their sets intersect. • Randomness is “in” the vertices. • Edges reflect relationships between vertices.
Threshold Graphs 0.5 0.6 0.3 0.8
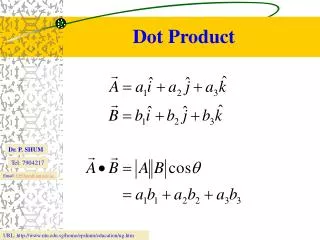
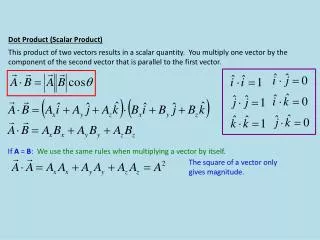
Dot Product Graphs [1 0] [2 0] [0 1] [1 1] Fractional intersection graphs
Physical Networks Internet Telephone Power grid Local area network
Alice Bob Social Networks 2003-4-10 B A
Example: Email at HP • 485 employees • 185,000 emails • Social network (who emails whom) identified 7 “communities”, validated by interviews with employees.
Properties of Social Networks • Clustering • Low diameter • Power law
Properties of Social Networks • Clustering • Low diameter • Power law b a c
Properties of Social Networks • Clustering • Low diameter • Power law “Six degrees of separation”
Properties of Social Networks • Clustering • Low diameter • Power law Degree Histogram log N(d) log d
Degree Histogram Example 1 2838 vertices Number of vertices degree
Degree Histogram Example 2 16142 vertices Number of vertices degree
Random Graph Models Goal: Simple and realistic random graph models of social networks.
Erdös-Rényi? • Low diameter! • No clustering: P[a~c]=P[a~c|a~b~c]. • No power-law degree distribution. Not a good model.
Model by Fan Chung et al Consider only those graphs with with all such graphs equally likely.
People as Vectors Sports Politics Movies Graph theory
Shared Interests Alice and Bob are more likely to communicate when they have more shared interests.
Whence the Vectors? • Vectors are given in advance. • Vectors chosen (iid) from some distribution.
Random Dot Product Graphs, II • Step 1: Pick the vectors • Given by fiat. • Chosen from iid a distribution. • Step 2: For all i<j • Let p=f(xi•xj). • Insert an edge from i to j with probability p.
Megageneralization • Generalization of: • Intersection graphs (ordinary & random) • Threshold graphs • Dot product graphs • Erdös-Rényi random graphs • Randomness is “in” both the vertices and the edges. • P[a~b] independent of P[c~d] when a,b,c,d are distinct.
Isolated Vertices Thus, the graph is not connected, but…
“Mostly” Connected “Giant” connected component A “few” isolated vertices
Six Degrees of Separation Diameter ≤ 6
Isolated Attached Attachedpair Diameter = 2 Diameter ≤ 6 Proof Outline
Graphs to Vectors The Inverse Problem
Given Graphs, Find Vectors • Given: A graph, or a series of graphs, on a common vertex set. • Problem: Find vectors to assign to vertices that “best” model the graph(s).
Maximum Likelihood Method • Feasible in dimension 1. Awful d>1. • Nice results for f(t) = t / (1+t).