Download
1 / 37
380 likes | 996 Views
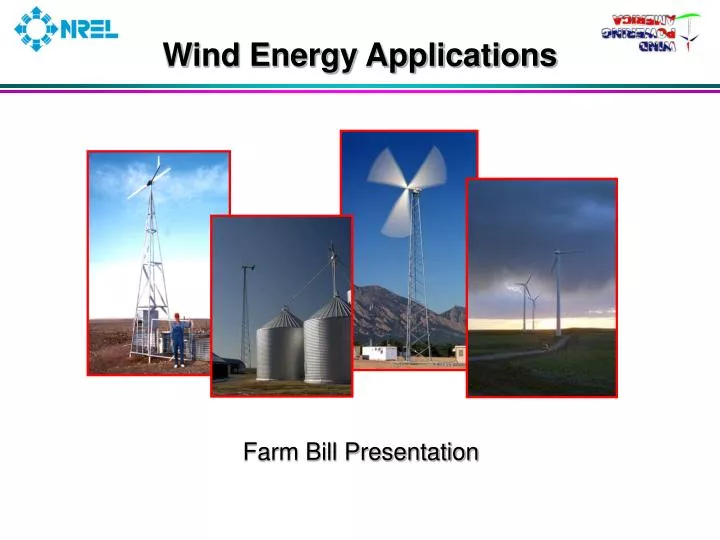
Wind Energy Applications Farm Bill Presentation Sizes and Applications Small ( 10 kW) Homes Farms Remote Application Intermediate (1 0-250 kW) Village Power Hybrid Systems Distributed Power Large (660 kW - 2+MW) Central Station Wind Farms Distributed Power Community Wind

E N D
Wind Energy Applications Farm Bill Presentation
Sizes and Applications • Small (10 kW) • Homes • Farms • Remote Application • Intermediate • (10-250 kW) • Village Power • Hybrid Systems • Distributed Power • Large (660 kW - 2+MW) • Central Station Wind Farms • Distributed Power • Community Wind
Large and Small Wind Turbines are Different • Large Turbines (500-1500 kW)• Installed in “Windfarm” Arrays Totaling 1 - 100 MW • $1,000/kW; Designed for Low Cost of Energy • Requires 6 m/s (13 mph) Average Sites • Small Turbines (0.3-100 kW)• Installed in “Rural Residential” On- Grid and Off-Grid Applications • $2,500-5,000/kW; Designed for Reliability / Low Maintenance • Requires 4 m/s (9 mph) Average Sites
Growth of Wind Energy Capacity Worldwide Actual Projected Jan 2003 Cumulative MW Rest of World = 2,803 North America = 5,018 Europe = 21,319 Rest of World Rest of World North America North America Europe Europe MW Installed Year Sources: BTM Consult Aps, March 2001 Windpower Monthly, January 2003
Drivers for Wind Power • Declining Wind Costs • Fuel Price Uncertainty • Federal and State Policies • Economic Development • Green Power • Energy Security
Wind Cost of Energy 12 10 8 Low wind speed sites COE (¢/kWh [constant 2000 $]) 6 Bulk Power Competitive Price Band High windspeed sites 4 2 0 1990 2010 2020 1995 2005 2015 2000
Wind Economics – Determining Factors • Wind Resource • Financing and Ownership Structure • Taxes and Policy Incentives • Plant Size: equipment, installation and O&M economies of scale • Turbine size, model, and tower height • Green field or site expansion • What is included: land, transmission, ancillary services
11 10 INDUSTRIAL 9 ELECTRIC GENERATION 8 THE KEY DRIVER 7 6 Trillion Cubic Feet/Yr 5 RESIDENTIAL 4 COMMERCIAL 3 2 GAS CONSUMPTION: 1997-2017 1 1997 2002 2007 2012 2017 The “Dash to Gas”
Economic Development Impacts • Land Lease Payments: 2-3% of gross revenue $2500-4000/MW/year • Local property tax revenue: 100 MW brings in on the order of $500,000 - 1 million/yr • 1-2 jobs/MW during construction • 2-5 permanent O&M jobs per 50-100 MW • Local construction and service industry: concrete, towers usually done locally • Investment as equity owners: production tax credit, accelerated depreciation
Wind Power Provides Rural Economic Benefits • 240 MW of wind in Iowa • $640,000/yr in lease payments to farmers ($2,000/turbine/yr) • $2 million/yr in property taxes • $5.5 mil/yr in O&M income • 40 long-term O&M jobs • 200 short-term construction jobs • Doesn’t include multiplier effect • 107 MW wind project in MN • $500,000/yr in lease payments to farmers • $611,000 in property taxes in 2000 = 13% of total county taxes • 31 long-term local jobs and $909,000 in income from O&M (includes multiplier effect)
Wind Power Provides Rural Economic Benefits • 40 MW of wind in South Dakota = $400,000 - $450,000/yr for Hyde County, including: • More than $100,000/yr in annual lease payments to farmers ($3,000 - $4,000/turbine/yr) • $250,000/yr in property taxes (25% of Highmore’s education budget) • 75 -100 construction jobs for 6 months • 5 permanent O&M jobs • Sales taxes up more than 40% • Doesn’t include multiplier effect
Key Deployment Issues for Wind Power • Permitting and Siting (visual, noise, avian, land use) • Transmission: capacity allocation, RTO formation, new line builds/planning • Power Variability: impact on utility operations • Evolving competitive markets • Green power markets • Policy environment – PTC, RPS, state tax provisions
The Wind Project Development Process Site Selection Land Agreements Wind Assessment Environmental Review Economic Modeling Interconnection Studies Permitting Sales Agreements Financing Turbine Procurement Construction Contracting Operations & Maintenance
Case Study: Off-Grid Water-Pumping • Ranch near Wheeler, Texas • Water-pumping for 120 head of cattle • Whisper H80 wind turbine, 1 kW, 9-ft rotor, 30-ft tower
Case Study:AOC 15/50 powers school in Clarion, IA • This AOC 15/50 wind turbine on a farm in Clarion, Iowa save the Clarion-Goldfield Community School about $9,000 per year on electrical purchase and provides a part of the school's science curriculum.
Case Study: On-Grid Farm • Southwestern Kansas • Utility bill reduction • Bergey Windpower Excel turbine,10 kW, 23-ft rotor, 100-ft tower • Electricity production ~21,000 kWh/year • Utility bill savings ~$2,800/year • Installed in early 1983, ~$20,000 • Received federal tax credit • Maintenance costs, $50/year • One lightning strike, one blade was replaced
Load Load Net Metering of Renewable Energy Energyconsumedimmediately retail rate Excess energy used to offset consumption at another time retail rate Net excess energy (determined monthly or annually): retail rate, avoided cost, or given to the utility 02770316
Wales, Alaska • Capacity: .1 MW, completed in 2000 • Turbine Manufacturer: Atlantic Orient Corporation • Developer: Kotzebue Electric Association
Saint Paul Island, Alaska • Turbine Size: 225 kW • Turbine Manufacturer: Vestas • Developer/owner: Northern Power Systems • Capacity: .225 MW
Rosebud, South Dakota • Turbine Size: 750 KW • Turbine Manufacturer: NEG Micon • Turbine Owner: Rosebud Sioux Indian Reservation (Commissioned March 2003) • PPA: Basin Electric • Green Tags: Native Energy, US Air Force
Spirit Lake • Turbine Manufacturer: NEG Micon • Size: 750 kw • Owner: Spirit Lake Community Schools • Operational: October 2001 Photo courtesy of AWEA
Chamberlain, South Dakota • Turbine Size: 1300 kW • Turbine Manufacturer: Nordex • Developer: Crown Butte Wind Power • Capacity: 2.6 MW
Moorhead, Minnesota • Turbine Size: 750 kW • Turbine Manufacturer: NEG Micon • Developer: Moorhead Public Service • Capacity: .75 MW
Algona, Iowa • Turbine Size: 750 kW • Capacity: 2.25 MW • Turbine Manufacturer: Zond Corporation • Turbine Owner: Consortium/Cedar Falls is lead with 2/3 ownership “In my 44 years in the municipal utility business, no utility project has ever generated more customer support and interest than our wind turbine project.” Nick Scholer, former manager of Algona Municipal Utilities, Algona, Iowa
Ponnequin, Colorado • Turbine Manufacturer: Vestas, NEG Micon • Developer/owner: DisGen/Xcel Energy • Turbine Size: 660-750 kW • Capacity: 31.5 MW • Commissioned: 1999
Highmore, South Dakota • Turbine Manufacturer: GE Wind • Developer/Owner: FPL Energy • Size: 1.5 MW • Capacity: 40 MW
Lamar, Colorado • Turbine Size: 1.5MW • Manufacturer: GE Wind • Developer/Owner: GE Wind/Shell, PPM • Capacity: 162 MW • Commissioned: 2003
Umatilla Oregon & Walla Walla County, Washington • Turbine Size: 660 kW • Turbine Manufacturer: Vestas • Developer/Owner: FPL Energy • Capacity: 262 MW
Wind Energy Financehttp://analysis.nrel.gov/windfinance/login.asp • Features • Extensive help file explains each entry • Easily handles a variety of tax parameters • Exportable summaries and cash flows • Inputs • General Assumptions (e.g. Project size, Inflation rate) • Capital Costs • Operating Costs • Financing Assumptions • Tax Assumptions • Constraining Assumptions (e.g. Minimum IRR, Minimum Debt Service Coverage Ratio) • Outputs • Internal Rate of Return • Debt Service Coverage Ratio • Net Present Value • Cash Flows
Carpe Ventem www.windpoweringamerica.gov