Download
1 / 18
180 likes | 308 Views
Low Energy Hydrogen Sensor Linke, S., Dallmer, M., Werner R. and Moritz, W. Humboldt University of Berlin, Brook-Taylor-Str.2, 12489 Berlin, Germany; email: werner.moritz@rz.hu-berlin.de. Hydrogen response. Fire detection. Sensor structure. Thermal reactivation. LFL Explosion alarm.

E N D
Low Energy Hydrogen SensorLinke, S., Dallmer, M., Werner R. and Moritz, W.Humboldt University of Berlin, Brook-Taylor-Str.2, 12489 Berlin, Germany;email: werner.moritz@rz.hu-berlin.de Hydrogen response Fire detection Sensor structure Thermal reactivation LFL Explosion alarm
Palladium Si3N4 SiO2 Si • Disadvantages of available • hydrogen sensors: • energy consumption too high for battery powered systems due to elevated working temperature • price to high for mass products • poor selectivity Sensor structure
Electrochemical mechanism ((different to Lundström type)) CV-measurement Palladium Si LaF3
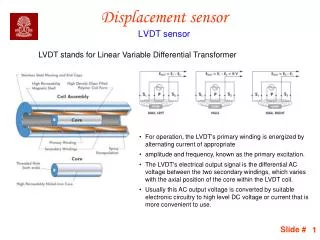
Response of the Pd/LaF3/Si3N4/SiO2/Si field effect structure (solid line and left scale) to different concentrations of hydrogen (doted line and right scale) in synthetic air; room temperature; measurement 1 hour after preparation of the Pd layer
Heating and temperature measurement No method for fast surface temperature measurement 4-point measurement resistance of Pt 1 - Pt; 2 - LaF3; 3 - SiO2/Si3N4; 4 - n-Si; 5 - ohmic contact
Calculations of temperature distribution 1 s 10 W 10Ws LaF3 240 nm SiO2/Si3N4 80nm 10 ms 100W 1mWs 100ns 1000W 100mWS
Constant surface temperature Parameters of the electrical heating pulse used in Fig. above Max. current 8,4A Cur. dens. 2,8*107 Acm-2 Max. voltage 293 V Max. power 2365 W Total energy 1,82*10-3 J ((average 2x10⁻⁸ W)) TSi=0,025 K 500 activations simulating 2 years
Temperature distribution for different impulse duration Average power consumption 2x10⁻⁶ W Fast decay to room temperature
Low concentration range Hydrogen signal in air after thermal reactivation 136 mV/decade room temperature Limit of detection 500 ppb
A Fire Experiment in a Wooden House.......... T- Amamoto et al., Sensors and Actuators, B1 (1990) 226-230
Early state of Fire (smoldering) TF 2 wood on electrical heater
High concentration range LFL 4% (40 000 ppm) alarm level 1,6% Response time t90 (@8000 ppm)= 4 s 150 mV/dec
Stress test simulating 330 days of activations and mesurements all 330 measurements Day 2, 50, 150 and 300
Mechanism Oxygen sensor O2 + A* O2 (A*)(1) O2 (A*) + H2O + e-HO2 (A*) + OH- (2) OH- + (F*) OH-(F*) (3) Additional hydrogen action O2 (A*) + H2 H2O (A*) (4)
Conclusions • - room temperature hydrogen sensor in ppm range and for high concentration • thermal reactivation is possible • Low energy consumption for heating impuls • early fire detection • alarm at lower explosion level • Battery power application for long time • Combination with energy harvesting technology possible