Download
1 / 2
0 likes | 5 Views
Data Analysis Online Course - Join now in Visualpath Training Institute and enhance your career by learning Data Analysis Online Training Course by real-time experts and with live projects, get real-time exposure to the technology. Call on 91-9989971070. <br>Telegram: https://t.me/ bEu9LVFFlh5iOTA9<br>WhatsApp : https://www.whatsapp.com/catalog/919989971070/<br>Visit : https://www.visualpath.in/data-analytics-online-training.html<br>

E N D
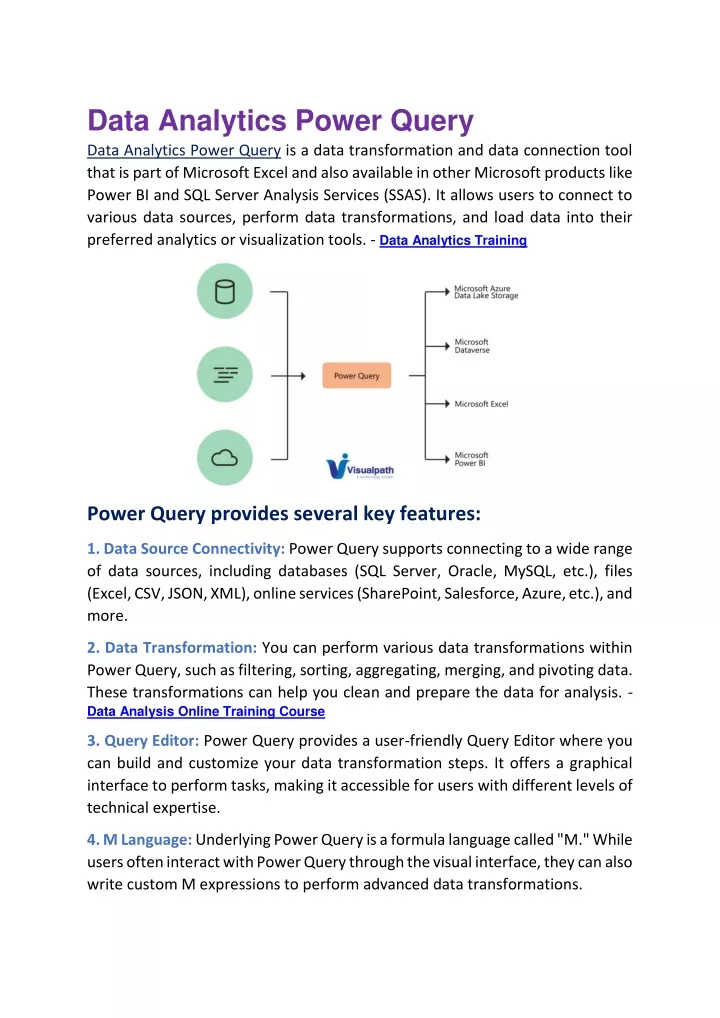
Data Analytics Power Query Data Analytics Power Query is a data transformation and data connection tool that is part of Microsoft Excel and also available in other Microsoft products like Power BI and SQL Server Analysis Services (SSAS). It allows users to connect to various data sources, perform data transformations, and load data into their preferred analytics or visualization tools. - Data Analytics Training Power Query provides several key features: 1. Data Source Connectivity: Power Query supports connecting to a wide range of data sources, including databases (SQL Server, Oracle, MySQL, etc.), files (Excel, CSV, JSON, XML), online services (SharePoint, Salesforce, Azure, etc.), and more. 2. Data Transformation: You can perform various data transformations within Power Query, such as filtering, sorting, aggregating, merging, and pivoting data. These transformations can help you clean and prepare the data for analysis. - Data Analysis Online Training Course 3. Query Editor: Power Query provides a user-friendly Query Editor where you can build and customize your data transformation steps. It offers a graphical interface to perform tasks, making it accessible for users with different levels of technical expertise. 4. M Language: Underlying Power Query is a formula language called "M." While users often interact with Power Query through the visual interface, they can also write custom M expressions to perform advanced data transformations.
5. Data Load: After you've transformed your data, you can load it into your preferred destination, such as Excel worksheets, Power Pivot, or Power BI for further analysis and visualization. - Data Analytics Course in Hyderabad 6. Refreshing Data: Power Query makes it easy to refresh the data, ensuring that your analysis remains up-to-date with the latest information from the source. 7. Data Mashup: In Power Query, you can combine data from multiple sources and perform complex data mashups. This allows you to create a comprehensive dataset for analysis. Power Query is particularly useful for data analytics because it streamlines the process of acquiring, transforming, and loading data for analysis. It helps users save time and reduce errors that may occur during manual data cleaning and transformation. With Power Query, you can create repeatable and automated data preparation workflows, making it a valuable tool for both beginners and advanced data analysts. - Data Analytics Online Training Institute Visualpath is the Leading and Best Institute for learning Data Analytics Course in Hyderabad, Hyderabad. We provide Data Analytics Online Training, you will get the best course at an affordable cost. Attend Free Demo Call on - +91-9989971070. Visit online-training.html : https://www.visualpath.in/data-analytics-