Download

1 / 56
600 likes | 1.08k Views
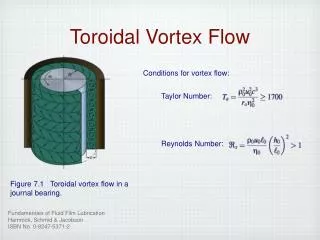
Vortex. Arena. Water cooler and Air heater. Warm water. Turbine & generator. Warm air. Ambient air. Cool water. Illustration by: Charles Floyd. Wet cooling tower AVE – Side view Capacity approximately 200 MW .

E N D
Vortex Arena Water cooler and Air heater Warm water Turbine & generator Warm air Ambient air Cool water Illustration by: Charles Floyd
Wet cooling tower AVE – Side view Capacity approximately 200 MW
The AVE replaces the physical chimney with centrifugal force in a vortex. • The AVE eliminates the solar collector by using waste heat or natural low temperature heat sources.
Cooling Towers Mechanical Draft: $15 million 40 m tall mechanical draft tower uses 1% to 4% of power output to drive fans. (uses energy) Natural Draft: doesn’t need fans but is 150 m tall and costs $60 million. (saves energy) Vortex Cooling Tower: $15 million 40 m tall to function like a natural draft tower. (produces energy!)
Typical Vortex Engine Size • Circular wall diameter 50 to 200 m • Circular wall height 30 to 80 m • Vortex base diameter 20 to 50 m • Vortex height 1 to 20 km • Heat input 1000 MW. 20, 50 MW cooling cells • Electrical output 200 MW. 20, 10 MW turbines • Specific work 1000 to 20000 J/kg • Air flow 20 to 100 Mg/s • Water flow 40 to 200 Mg/s
4 m diameter prototype transparent wall view
Petrolia 4 m prototype vortex
Petrolia 4 m prototype vortex Video available at: http://vortexengine.ca/LM6/20080925155414-1.mpg
CFD Results • Ontario Centre of Excellence (OCE) and the University of Western Ontario (UWO) Boundary Layer Wind Tunnel Laboratory (BLWTL) recently completed a Computational Fluid Dynamics (CFD) study of the AVE • Results for a 1 m diameter model simulation with a domain height of 2 m are shown below
Airflow in a Vortex at Altitude Centrifugal force Pressure gradient force Rotation Low pressure High pressure Diagram adapted from Divine Wind by: Kerry Emanuel At altitude, the pressure gradient force (inwards) exactly equals the centrifugal force (outwards). The air rotates without a significant radial component
Airflow in a Vortex at Ground Level Pressure gradient force Centrifugal force Rotation Low pressure High pressure Diagram adapted from: Divine Wind by: Kerry Emanuel friction Near the ground, friction acts to reduce the rotational velocity and hence the centrifugal force. The air spirals towards the centre.
Natural Vortices Waterspout Tornado
Hurricane NASA
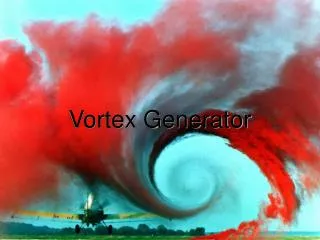
Fire whirls Accidental Deliberate Source: Nate Smith
Courage Source: Nate Smith
A hurricane viewed as a Carnot cycle Efficiency n = 1 – Tc / Th = 1 – 200/300 = 33% Source Divine Wind by Kerry Emanuel
Single Tube Gravity Cycle Single tube gravity cycle
Willis Island Sounding CAPE Updraft Pressure (hPa) Dry Bulb Dew Point Temperature (C)
Hurricane Isabel Intensity SST 25 to 26.5 C Temperature approach 1 C - Relative humidity 97%
Hurricane Isabel effect on sea surface temperature as observed from satellite
The Carnot Potential Wind Speed Map showing the maximum wind speed in MPH achievable by tropical cyclones over the course of an average year according to Carnot’s theory of heat engines. Source: Divine Wind by Kerry Emanuel