Download
1 / 54
560 likes | 762 Views
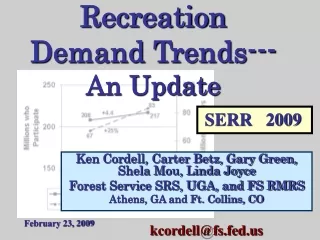
Recreation Demand Trends--- An Update. May 5, 2009. Ken Cordell, Carter Betz, Gary Green, Shela Mou Forest Service SRS, UGA, and FS RMRS Athens, GA and Ft. Collins, CO. http://warnell.forestry.uga.edu/nrrt/nsre/index.html. kcordell@fs.fed.us. Outline. Drivers of Trends

E N D
Recreation Demand Trends---An Update May 5, 2009 Ken Cordell, Carter Betz, Gary Green, Shela Mou Forest Service SRS, UGA, and FS RMRS Athens, GA and Ft. Collins, CO http://warnell.forestry.uga.edu/nrrt/nsre/index.html kcordell@fs.fed.us
Outline • Drivers of Trends • Some recently reported outdoor recreation trends---Up through 2007 • Outdoor recreation generally • Nature-based recreation specifically • Forest recreation especially • Visitation to public land • Current changes in drivers of trends • Gasoline, the economy, ……, Others • Kids • Current Trends and Summary http://warnell.forestry.uga.edu/nrrt/nsre/IrisReports.html
What got us started looking at current trends-- The Pergams/Zaradic article February, 2008 • Postulated that NP visits is a good proxy for visiting nature in general • “If we are also seeing declines in the majority of other nature-related activities, it becomes quite likely that we are seeing a fundamental shift away from people’s interest in nature.” • “…as today’s adult role models spend less time in nature, this generation of children is also likely to follow suit. • They argue (with this I agree) that less nature experience may be associated with less support for conservation • The authors report declines in NP, SP, NF and BLM visits (PER CAPITA, Not Total) • The research question was: “Is there a general and fundamental shift away from people’s participation in nature-based recreation and interest in nature?”
Source • The Forest Service’s Resources Planning Act (RPA) Assessment examines the status and futures of the Nation’s renewable resourceson all forest and rangelands. • Renewable resources evaluated include fish and wildlife, water, forests, range, wilderness, as well as the demand for and ability of these resources to provide outdoor recreation opportunities. www.fs.fed.us/research/rpa/pubs-supporting-interim-update-of-2000-rpa-assessment.shtml
National Kids Survey Primary Data Source is National Survey on Recreation and the Environment---NSRE • The Athens Forest Service Research Group has been collecting data since the 1980s. • The core of the NSRE survey covers outdoor recreation and personal demographics. It originated in 1960. • NSRE is a cross section survey of non-institutionalized residents 16 years or older. • Since 1999, the annual sample has been 5,000, or more, per year. • Respondents are asked about more than 80 outdoor activities • Two primary partners, the University of Georgia and the University of Tennessee. • NSRE is the demand data basefor half the states’ SCORPs
THEN A Quick Recreation History • In 1960, the U.S. population reached about 180 million. Along with increasing affluence, population growth boosted demand for outdoor recreation. • Family vacations and summer trips quickly became a significant part of the typical American’s calendar. • As reported by ORRRC, the most popular summertime outdoor recreation activities in 1960 were, in order, driving for pleasure, swimming, walking, playing outdoor games or sports • Also sightseeing, picnicking, fishing, bicycling, attending outdoor sports events, boating, nature walks, and hunting • And camping, horseback riding, water skiing, hiking, and attending concerts or other outdoor events.
40 Years Later By 2000 • By 2000, the population had risen to around 281 million (growing over 3 million per year) • Viewing and photographing birds had become the fastest-growing activity in the country. • Closely following birding were day hiking and backpacking, growing 193 and 182 percent in participants, respectively, in less than twenty years. • Snowmobiling increased125 percent. Next were attending outdoor concerts, plays, and other events; walking for pleasure; camping in developed sites; canoeing or kayaking; downhill skiing; and swimming in natural waters (i.e., streams, lakes, and oceans). • The most noticeable change by 2000 was growth in the proportion of population participating in outdoor activities. • Also, growth in interest in nature study.
Though the technology of outdoor equipment and clothing has evolved dramatically over the years, all of the activities popular in the 1950s, 1960s and 1970s are still popular. • However, many other key aspects of society and of outdoor recreation have been changing, not just the technology. The equipment used now is quite different, relative to the 1960s. The Nyman family portaging on the Superior National Forest in Minnesota in 1965. (Forest History Society Photo Archives) Photo source, Forest History Society
Some of the Drivers of change up to last year U. S. Department of Transportation
URBANIZATION---Percent of County that is Urban (2000) Urban = 500 persons per square mile
Historic and Projected Population by Ethnicity The cultural mix was/is/will change
Economic growth Real GDP Growth --- Among its peer group of nations, the United States ranked first in growth with an average annual seasonally adjusted real GDP growth rate of 2.7 percent from the first quarter of 2001 through the third quarter of 2005. Source: U. S. Joint Economic Committee
Average cost of a gallon of gasoline, all grades averaged, as of June 2008, was still rising
National Household Travel Survey No more miles, but more time spent in transit 1990 49 min. 1995 56 min. 2001 62 min.
GROWTH OF INTERNET USERS WORLD- WIDE • Dec. 1995 16 Million • Dec. 1997 70 Million • Dec. 1999 248 Million • Dec. 2000 451 Million • Dec. 2003 719 Million • April 2004 757 Million • April 2005 934 Million • Now, Approaching 1.6 Billion It is estimated that as many as 60% of internet users also play video games Approaching 1/4 of world population Source: Internet World Stats
Housing unit density around the Stanislaus National Forest, Year 2000 and 2030. Housing density data source: D. Theobald, 2005
Outdoor Recreation Trends UP Through 2007 Outdoor recreation is deeply rooted in the U. S., but is there a fundamental change underway? Pre-recession and pre-2008 gas price surge
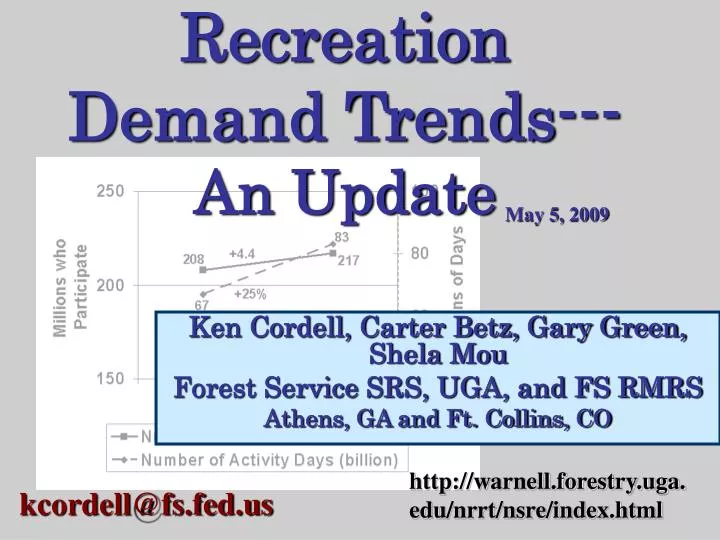
How did all the changes up through 2007 affect recreation participation? • Trends in outdoor recreation generally • Between 2000 and early 2008, the total number of people who participated in one or more activities grew by 4.4 percent • At the same time, the sum total number of days of participation increased from 67 billion to 84 billion, approximately +25 percent Figure 1.—Growth in number of people and number of activity days in 60 outdoor recreation activities in the United States, 2000–2007. Source: National Survey on Recreation and the Environment
Trends through 2007 in nature-based outdoor recreation • Growth in some near-home activities (e.g., wildlife watching or swimming); others remote (such as backpacking or climbing). • Between 2000 and 2007, the total people participating in nature-based activities grew by 3.1 percent. • Number of days of participation grew about 32 percent. • Over all 50 nature-based activities, per capita days increased by more than 22 percent. Figure 2.—Growth in number of people and number of participation days in 50 nature-based outdoor recreation activities in the United States, 2000–2007. Source: National Survey on Recreation and the Environment
Interest in visiting, viewing, photographing nature was growing
Driving ATVs, off-road motorcycles, other OHVs growing rapidly
Technical, risk-oriented activities showing growth, mostly in dedication
Activity Mix is Changing • A few of the nature-based activities experienced decreases in both the number of people who participated and total days of participation • Primitive camping (not in developed campgrounds), backpacking, and mountain climbing showed decreases in the number of people who participated, but increases in the number of days of participation • Visiting prehistoric sites, saltwater fishing, and snorkeling showed increases in number of people who participated, but decreases in total days • For a sizable number of nature-based activities, however, both the number of people participating and the summed days of participation increased • Net effect, growth of nature-based recreation
Highlighting A few activities--Decreasing = Change 2000 - 2007 Activity Percent Participants Percent Days Picnicking -1.4 -17.2 Visiting Historic Sites -4.5 -15.2 Day Hiking 6.8 -20.9 Visiting Prehistoric sites 2.4 -7.3 Mountain Biking -8.0 -32.7 Cold Water Fishing -2.1 -7.0 Canoeing 2.3 -17.9 Rafting -16.8 -1.0 Downhill Skiing -14.8 -15.7
Highlighting a few other activities--Increasing = Change 2000 - 2007 Activity Percent Participants Percent Days Walking 9.6 13.9 Family gatherings outdoors 4.2 13.7 Swimming (not pools) 4.0 2.2 Gathering mushrooms/berries 16.1 1.9 Developed Camping 2.7 9.3 Warmwater fishing 7.3 5.6
Table 42-1—Millions of annual forest recreation activity days by activity, and percentages on public forest lands and in urban forests, 2007-2008. Within Nature-Based Recreation lays Forest Recreation Millions of activity days Top 7 activities Walk for pleasure 7,493.3 View/photograph natural scenery 6,170.6 View/photograph wildflowers, trees, other wild plants species 4,858.9 View/photograph birds 3,738.3 View/photograph other wildlife 3,086.8 Day hiking on trails 1,234.8 Visit a wilderness/primitive area 947.6 Nearly 60 percent of nature-based recreationoccurs in forested settings---self reported Source: NSRE 2005-2008, Versions 1-3b.
Table 42-1—Millions of annual forest recreation activity days by activity, and percentages on public forest lands and in urban forests, 2007-2008. Public forest lands are important for recreation Forest Recreation • Almost 44 percent of the 751 million acres of forest in the U. S. is publicly owned and managed and is pretty much open to everyone • Forest-based recreation activities where ½ or more occurs on public landsinclude visiting wilderness, day hiking, visiting nature centers, and backpacking • Forest-based recreation activities where more than ½ occurs on private lands include, for example, small-game hunting, horseback riding, off-road driving, and gathering mushrooms and berries • Roughly 60 percent of forest recreationoccurs on public lands, and of course the other 40 percent is on private forest lands Source: NSRE 2005-2008, Versions 1-3b.
Visitation to Public Lands Level to Increasing, except NFs • The paper back in February in the PNAS said that public land visitation was in steep decline. But, that was per-capita, not total. • Agency data showed state park, national park, and national wildlife refuge visitation stable or increasing since the 90s. • State park visitation in 2007 rose back above the former level reported in 2001 (a 0.7% increase) (National Association of State Park Directors, 2007). 2008 numbers coming. • National Park visitation had been stable since 2001, but in 2007, visitation rose by almost three million. 2008 numbers coming. • National wildlife refuge visitation has grown from 33 million in 1998 to over 40 million in 2007, growth of 21 percent • The NF trend not available earlier, but now shows -13% 2004 - 2007 Year Millions of Visits 1975 471 1985 660 1995 746 2000 767 2001 735 2003 735 2005 715 2006 711 2007 740 National Park Visitation Trend State Park Trend
Any Validation out there? participation among Americans ages 18 to 64 increased 2006 - 2007 Focuses mostly on Physically Challenging Measured outdoor activities include: Backpacking, BMX Bicycling, Mountain Bicycling, Road Bicycling, Bird Watching Outdoors, Camping, RV Camping, Canoeing, Sport Climbing, Bouldering, Indoor Climbing, Ice Climbing, Traditional Climbing, Mountaineering, Fly Fishing, Freshwater Fishing, Saltwater Fishing, Hiking, Hunting, Kayaking, Whitewater Kayaking, Adventure Racing, Triathlon, Rafting, Running/Jogging, Skateboarding, Trail Running, Wildlife Viewing, Downhill Skiing, Telemark Skiing, Cross-Country Skiing, Snowboarding, Snowshoeing, Windsurfing, Sailing, Scuba Diving, Snorkeling, Surfing and Wake Boarding.
BUT, What happens to Recreation Trends when we add data from 2008 to early 2009---vast changes in the drivers of demand? • The economy---recession actually began Jan. 2007 (recession = reduced growth in real GDP in 2 successive quarters) • Gasoline (doubled over price in 2004) • Climate change (now widely evident) • Etc.
Marketvector.com Straight line extension ……………………… US Unemployment Rate---Past Present and Future
Marketvector.com US Personal Income---Past Present and Future
Average Price of Gasoline Summer 08 Athens this morning $1.95
Frost-Free Days Are Increasing Synthesis and Assessment Report 3.3 Weather and climate extremes in a changing climate
SO, What does happen to Recreation Trends when we add data from 2008 to early 2009? • The economy---recession actually began Jan. 2007 (recession = reduced growth in real GDP in 2 successive quarters) • Gasoline (doubled over price in 2004) • Climate change (now widely evident) • Etc.
Total annual recreation activity days, moving 3-year averages Current Trends The trend, Steady 2000 = 0.0 Hunting and Fishing NSRE – National Survey on Recreation and the Environment
Total annual recreation activity days, moving 3-year averages Mixed but Steady Backcountry Activities NSRE---National Survey on Recreation and the Environment
Total annual recreation activity days, moving 3-year averages Mixed, slight decline Non-Motor Boating Activities NSRE – National Survey on Recreation and the Environment
Total annual recreation activity days, moving 3-year averages Going down Snow Skiing and Boarding NSRE – National Survey on Recreation and the Environment
Total annual recreation activity days, moving 3-year averages One up, one down Motorized Activities NSRE – National Survey on Recreation and the Environment
Total annual recreation activity days, moving 3-year averages Reached new Plateau Viewing/Photographing Nature NSRE – National Survey on Recreation and the Environment
Total annual recreation activity days, moving 3-year averages Viewing/Photographing Up, Skiing Down Indexing for Groupings of Activities NSRE – National Survey on Recreation and the Environment
Do we know what the trend is, or will be? • The future is uncertain. • Some dramatic long-term changes are underway • Population • Migration • Climate change • Technology • Land development • Culture • Change in what KIDs do …….
A Preliminary Look at the 2008 NSRE Kids Survey H. Ken Cordell Carter J. Betz Gary T. Green National Survey on Recreation and the Environment USDA Forest Service Southern Research Station Athens, Georgia National Kids Survey
National Kids Survey • On-going survey of Kids 6 – 15 to measure outdoor activity, lifestyles andconstraints • 65% spend 2 or more hours outside on average weekdays • 74% spend 2 or more hours outside on average weekend days • For most boys activities include just playing outdoors or hanging out; biking, jogging, walking, skate boarding, etc.; or playing or practicing team sports • For most girlsactivities include just playing outdoors or hanging out; biking, jogging, walking, skate boarding, etc.; or studying orreading while sitting outdoors • Other sports,e.g., tennis, golf, and attending camps, field trips, outdoor classes also important activities
National Kids Survey • On-going survey of Kids 6 – 15 to measure outdoor activity, lifestyles and constraints • 65% spend 2 or more hours outside on average weekdays • 74% spend 2 or more hours outside on average weekend day • For most boys activities include just playing outdoors or hanging out; biking, jogging, walking, skate boarding, etc.; or playing or practicing team sports • For most girls activities include just playing outdoors or hanging out; biking, jogging, walking, skate boarding, etc.; or studying or reading while sitting outdoors • Other sports, e.g., tennis, golf, and attending camps, field trips, outdoor classes also important activities “More” is partly the effect of being a little older this year, than last year
Outdoor Activities of Youth 6 to 19 Years Old---Notice different rates between males and females (of the 96 % who go outdoors) Most Popular Nature Based