Download
1 / 36
360 likes | 613 Views
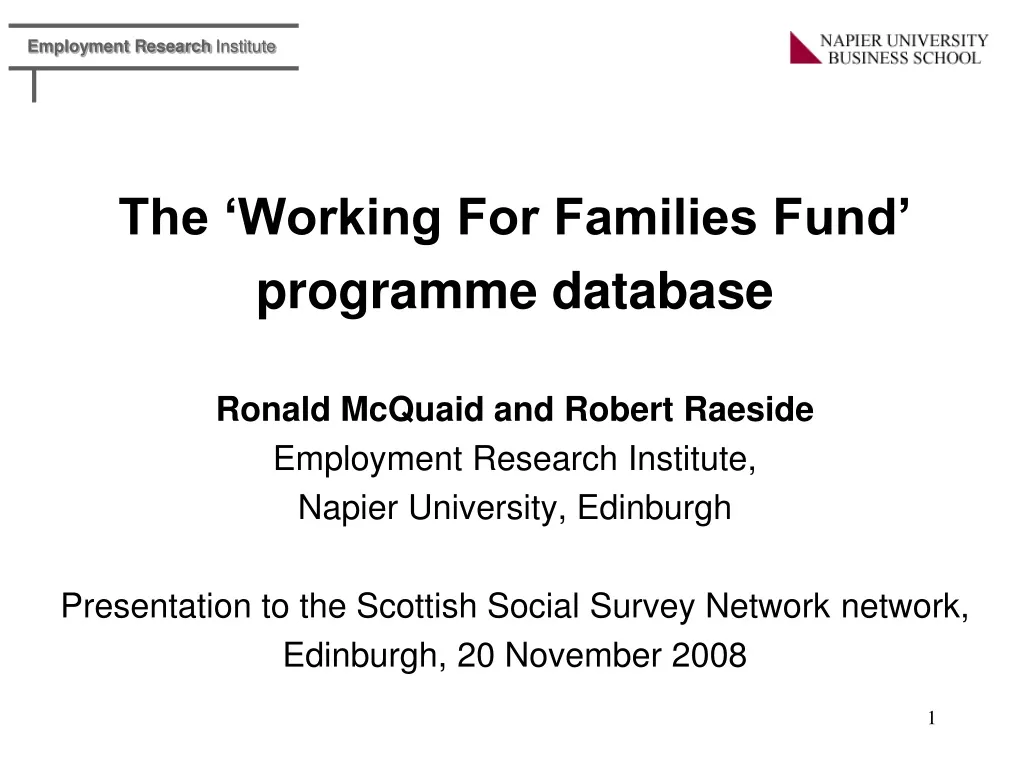
The ‘Working For Families Fund’ programme database Ronald McQuaid and Robert Raeside Employment Research Institute, Napier University, Edinburgh Presentation to the Scottish Social Survey Network network, Edinburgh, 20 November 2008. Structure of the presentation.

E N D
The ‘Working For Families Fund’ programme databaseRonald McQuaid and Robert RaesideEmployment Research Institute, Napier University, Edinburgh Presentation to the Scottish Social Survey Networknetwork, Edinburgh, 20 November 2008
Structure of the presentation • Background and aims of Working for Families Fund • The evaluation • Data collection • Some examples of the analysis, Regression, Panel data, Propensity Score Matching • Conclusions
ERI Team • Many people were involved in the evaluation team over the 4 years (2004-08). These include: • Ronald McQuaid • Sue Bond • Vanesa Fuertes • Cathy Craig • Robert Raeside • Plus Colin Lindsay • Jesus Canduela etc.
Aims of Working for Families Fund (WFF) • Funding and strategic management/objectives set by Scottish government; delivery by local authorities • Improve employability of lone parents and parents with barriers to work/labour market participation • Targeting lone parents, ‘households in poverty’, ‘households with stresses’ (drugs, mental health, etc.) • All participation voluntary
How to achieve aims of WFF • Improve awareness of and access to childcare • Improve knowledge of employability/training services • Offer limited new childcare/employability services • Engage and support parents through mentoring, advice, counselling, personalised support (Key worker model) • Help both inactive and those in work (breaking the low pay-no pay cycle)
Funding and geography of WFF • £50M (€72M) budget 2004-08 • 20 (initially 10) of Scotland’s 32 local authorities • 2004-06: 10 local authorities (2 rural areas with greatest economic inactivity, 8 areas with more than 3,000 children in benefit-dependent households) • 2006-08: further 10 local authorities • Local authorities’ populations ranging from 82,000 to 578,000; unemployment from 3% to 8% • Workless family households: 31% Glasgow; 12% Highland • Lone parent households: 42% Glasgow; 19% Dumfries
Evaluation research challenges • Detailed baseline of objective and perceived barriers to work – allows us to place outcomes in context and explain differences between individuals’ progress • Identify key issues that can affect employability • Identify aims and aspirations – compare outcome with what client wanted as well as policy aims • Changing aspirations may be positive ‘soft’ outcome • Consistent measure of changes in confidence
Evaluation research challenges (2) • Emphasis on FORMATIVE as well as SUMMATIVE evaluation – regular reporting • Formative evaluation – commitment (and data!) from practitioners in return for timely, useful analysis to inform policy development during the process • Developed system to provide – client monitoring data for WFF staff; evaluation data for researchers • Mixed methods – qualitative research on HOW and WHY the programme worked/did not work
Overview of Evaluation • Communication: Regular meetings and feedback to LAs and Scottish Government, events • Consistent data collection: Quarterly updates of data on registration, follow-up etc., Quality checking data • Case Studies • Triangulation • Control group • Analysis and recommendations
Evaluation research methods • Extensive interviews with clients at start (baseline) • Focus on employability: individual factors (skills, qualifications, experience); personal circumstances (childcare responsibilities, ‘household stresses’ such as drugs); external barriers (transport, benefits, jobs) • Income and employment status of self and spouse • Perceived barriers to work • Aim of participation; aspirations for the future • 10 point scales to measure confidence
Evaluation research methods • Extensive follow-up interviews with clients…after ‘major transition’ (got a job, got a better job, lost a job, started training); 6 months; on-going • Details of outcome: occupation, pay, hours, type of training, level of qualification • Impact of WFF? How could WFF be improved? • Follow up interviews to assess sustainability
‘Hard’ Outcomes (Key Transition) Outcomes Intermediate Activities ‘Soft’ Outcomes Employability Measures TYPES OF OUTCOMES 14
Numbers of New Clients Registered by Month to 31 December 2008 Total: 25,508 clients 16
Type of Latest KEY Transitions to 31 December 07 47% 31% Total Number of Transitions = 13,095 by March 2008 17
Intermediate Activity Outcomes (w/o Key Transition) to 31 March 07 Total IA outcomes without Key Transition = 850 18
Distance travelled: Change on Employability Measures – Change in Average Score between Registration and at Six-Month Review 19
All Client Outcomes to 31 March 2007 to 31 March 2008 No significant Outcome 28% (7,202) Key transition 51% (13,095) Registered in previous 6 month (no outcome expected) 7% (1,666) Valid Six Month monitoring Intermediate Activity 4% (906) Outcome 10% (2,576) 20
Measuring ‘distance travelled’ Among those still not working after six months: • Childcare now less of a barrier • Low self-esteem now less of a barrier, but…. • Scales demonstrated moderate progress in confidence-building, especially on childcare • Little progress on ‘external’ barriers such as access to transport, lack of social capital • Intractable problems around health/disability
Insights from policy case studies • 10 Phase One local authorities; 15 case studies • Overview of management, programme content • We were able to focus on individual local projects, e.g.: • access to transport in rural areas • money/debt advice • Work experience placements with employers • Financial support for childcare and training clients in childcare • We were able to regularly report on HOW projects operated, WHY they worked well – formative evaluation to share good practice and inform the continuing development of policy
Variation by Area (illustrative – not final results) Reference: West Lothian
Variables (illustrative – not final results) Percentage Correct = 85.5% Pseudo R Square = 24.7%
Draft Findings • Promoters • Qualifications • Age • Lone parent • Area – Glasgow or North Ayrshire • Inhibitors • Identifiable barriers • Under 20 • Having been out of work for any period • Being pregnant • Phase 2 Local Authority
Propensity Model Match to cases in “Control Group” – 198 from control and 668 from WFF Transition rate of 18% in control group and 52% n WFF and improvement of 188% - but! Cases in British Household Panel 1st September 2004 to 1st September 2005 BHPS = 40.6% WFF = 58.3% an improvement of 43.5% ( Matched on housing tenure own or rent -1202 matches from BHPS and 2115 from WFF)
Multi Level Model (illustrative – not final results) Individuals live in local authorities
Variation with Local Authority (illustrative – not final results) Glasgow City North Ayrshire Aberdeen City & Aberdeenshire Dundee
Residuals by Area (illustrative – not final results) South Lanarkshire Aberdeen city Aberdeenshire Dundee
Evaluating Working for Families Fund • Effectively targeted low-skilled lone parents with multiple barriers to work, limiting deadweight • Improved chances of finding work • Improved access to and knowledge of childcare • Sustained people in work through crisis • Confidence gains may lead to progress later • More help needed for those with fewer skills, those with severe household/skills problems
Reflecting on the evaluation • Avoiding simplistic ‘league table’ comparisons – in-depth, qualitative policy research and baseline data about clients allowed us to place results in context and explain differences across local authorities • In-depth, qualitative work = depth of understanding of HOW and WHY outcomes were achieved by different approaches • Case studies on policy help practitioners and policy makers to understand ‘what works’ and take action. • Formative evaluation of value to policy makers and service providers – sharing of good practice and informing policy development in process
The end For more information see the Scottish Government Website: www.scotland.gov.uk/ and the ERI website: www.napier.ac.uk/eri www.napier.ac.uk/randkt/rktcentres/eri/projects/Pages/WorkingforFamilies.aspx