Download
1 / 30
340 likes | 722 Views
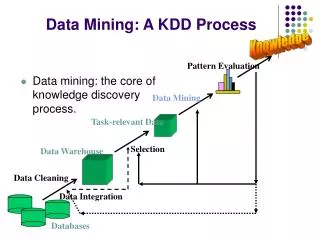
Knowledge Discovery & Data Mining. process of extracting previously unknown , valid , and actionable (understandable) information from large databases Data mining is a step in the KDD process of applying data analysis and discovery algorithms

E N D
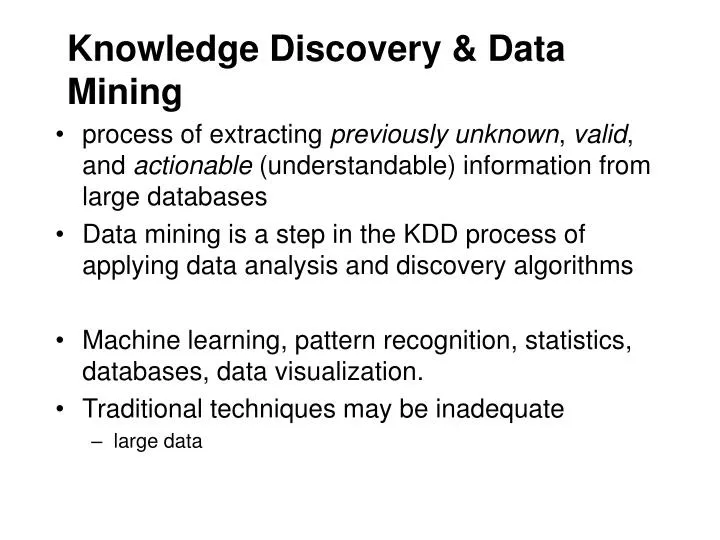
Knowledge Discovery & Data Mining • process of extracting previously unknown, valid, and actionable (understandable) information from large databases • Data mining is a step in the KDD process of applying data analysis and discovery algorithms • Machine learning, pattern recognition, statistics, databases, data visualization. • Traditional techniques may be inadequate • large data
Why Mine Data? • Huge amounts of data being collected and warehoused • Walmart records 20 millions per day • health care transactions: multi-gigabyte databases • Mobil Oil: geological data of over 100 terabytes • Affordable computing • Competitive pressure • gain an edge by providing improved, customized services • information as a product in its own right
Knowledge discovery in databases (KDD) is the non-trivial process of identifying valid, potentially useful and ultimately understandable patterns in data Data Mining Clean, Collect, Summarize Data Preparation Training Data Data Warehouse Model Patterns Verification, Evaluation Operational Databases
Data mining algorithm components • Model representation • descriptions of discovered patterns • overly limited representation -- unable to capture data patterns too powerful -- potential for overfit (decision trees, rules, linear/non-linear regression & classification, nearest neighbor and case-based reasoning methods, graphical dependency models) • Model evaluation criteria • how well a pattern (model) meets goals (fit function) • eg., accuracy, novelty, etc. • Search method • parameter search: optimization of of parameters for a given model representation • model search: considers a family of models Different methods suit different problems. Proper problem formulation crucial.
Note: Models and patterns: A pattern can be thought of as an instantiation of a model. Eg. f(x) - 3 x2 + x is a pattern whereas f(x) = ax2 + bx is considered a model. Data mining involves fitting models to and determining patterns from observed data.
Knowledge Discovery Process • Goal • understanding the application domain, and goals of KDD effort • Data selection, acquisition, integration • Data cleaning • noise, missing data, outliers,etc. • Exploratory data analysis • dimensionality reduction, transformations • selection of appropriate model for analysis, hypotheses to test • Data mining • selecting appropriate method that match set goals (classification, regression, clustering, etc) • selecting algorithm • Testing and verification • Interpretation • Consolidation and use
100 90 80 70 60 50 40 30 20 10 0 Business Objective Determination Data Preparation Data Mining Analysis of Results and Knowledge Assimilation Effort for each data-mining process step
Issues and challenges • large data • number of variables (features), number of cases (examples) • multi gigabyte, terabyte databases • efficient algorithms, parallel processing • high dimensionality • large number of features: exponential increase in search space • potential for spurious patterns • dimensionality reduction • Overfitting • models noise in training data, rather than just the general patterns • Changing data, missing and noisy data • Use of domain knowledge • utilizing knowledge on complex data relationships, known facts • Understandability of patterns
Data Mining • Prediction Methods • using some variables to predict unknown or future values of other variables • Descriptive Methods • finding human-interpretable patterns describing the data
Data Mining Tasks • Classification • Clustering • Association Rule Discovery • Sequential Pattern Discovery • Regression • Deviation Detection
Classification • Data defined in terms of attributes, one of which is the class • Find a model for class attribute as a function of the values of other(predictor) attributes, such that previously unseen records can be assigned a class as accurately as possible. • Training Data: used to build the model • Test data: used to validate the model (determine accuracy of the model) Given data is usually divided into training and test sets.
Classification: Direct Marketing • Goal: Reduce cost of soliciting (mailing) by targeting a set of consumers likely to buy a new product. • Data • for similar product introduced earlier • we know which customers decided to buy and which did not {buy, not buy} class attribute • collect various demographic, lifestyle, and company related information about all such customers - as possible predictor variables. • Learn classifier model
Classification: Fraud detection • Goal: Predict fraudulent cases in credit card transactions. • Data • Use credit card transactions and information on its account-holder as input variables • label past transactions as fraud or fair. • Learn a model for the class of transactions • Use the model to detect fraud by observing credit card transactions on a given account.
Clustering • Given a set of data points, each having a set of attributes, and a similarity measure among them, find clusters such that • data points in one cluster are more similar to one another • data points in separate clusters are less simislar to one another. • Similarity measures • Euclidean distance if attributes are continuous • Problem specific measures
Clustering: Market Segmentation • Goal: subdivide a market into distinct subsets of customers where any subset may conceivably be selected as a market target to be reached with a distinct marketing mix. • Approach: • collect different attributes on customers based on geographical, and lifestyle related information • identify clusters of similar customers • measure the clustering quality by observing buying patterns of customers in same cluster vs. those from different clusters.
Association Rule Discovery • Given a set of records, each of which contain some number of items from a given collection • produce dependency rules which will predict occurrence of an item based on occurences of other items
Association Rules:Application • Marketing and Sales Promotion: • Consider discovered rule: {Bagels, … } --> {Potato Chips} • Potato Chips as consequent: can be used to determine what may be done to boost sales • Bagels as an antecedent: can be used to see which products may be affected if bagels are discontinued • Can be used to see which products should be sold with Bagels to promote sale of Potato Chips
Association Rules: Application • Supermarket shelf management • Goal: to identify items which are bought together (by sufficiently many customers) • Approach: process point-of-sale data (collected with barcode scanners) to find dependencies among items. • Example • If a customer buys Diapers and Milk, then he is very likely to but Beer • so stack six-packs next to diapers?
Sequential Pattern Discovery • Given: set of objects, each associated with its own timeline of events, find rules that predict strong sequential dependencies among different events, of the form (A B) (C) (D E) --> (F) • xg :max allowed time between consecutive • event-sets • ng: min required time between consecutive • event sets • ws: window-size, max time difference between • earliest and latest events in an event-set (events • within an event-set may occur in any order) • ms: max allowed time between earliest and • latest events of the sequence.
Sequential Pattern Discovery: Examples • sequences in which customers purchase goods/services • understanding long term customer behavior -- timely promotions. • In point-of--sale transaction sequences • Computer bookstore: (Intro to Visual C++) (C++ Primer) --> (Perl for Dummies, TCL/TK) • Athletic Apparel Store: (Shoes) (Racket, Racketball) --> (Sports Jacket)
Regression • Predict a value of a given continuous valued variable (dependent variable) based on values of other variables (independent variables) • Statistics, Neural networks, Genetic algorithms • Examples: • predicting sales volumes of new product based on advertising expenditure • Time series prediction of stock market indices.
Visualization • complement to other DM techniques like Segmentation,etc.
Sample Data Mining Plan: Example • Bank concerned about attrition for its Demand Deposit Accounts • identify customers likely to leave, with sufficient warning of impending attrition to allow for some intervention (signature for impending attrition?) • Hypothesis testing • transaction data may be insufficient • explore ideas about why customers might leave, and how to identify • e.g. Regular bi-weekly direct deposit ceases: new job and no longer using direct deposits • got married and spouse used another bank: reduction in balance and number if transactions, last-name change request
Data requirements • Careful attention to data generated by internal decisions: • bank started charging for debit card transactions that were free • bank turned down loan or credit increase request • Is the data available? • Preparing data for analysis • Exploratory analysis of data • queries, OLAP, hypothesis testing • association rules • Knowledge Discovery plan • classes of customers rather than an overall signature of attrition? • Deviation from normal behavior indicating attrition potential
Preparing data for analysis • data organized over time-windows • demographic profiles • Clustering • unsupervised • models for different clusters
~ 40K cases HELOC customers DDA customers (~250K cases) Example:improving direct mail responses • Direct mailing for home equity line of credit (HELOC) • prospects are existing demand deposit account (DDA) customers • use info. on lifetime value of existing customers to derive model to predict customers likely to be the most profitable long-term prospects
Example • Data • DDA history of loan balances over 3,6,9,12,18 months, returned checks • demographic data (age, income, length of residence, etc.), both internal and external • property data sourced externally (home purchase price, loan-to-value ratio, etc.) • credit worthiness data • response to previous mailings • 120 variables selected • less than half the DDAs had history records; missing fields; (45 K cases remaining for use -- prospects database) • exclude variables like sex, race, age (legal restrictions) • Neural network (radial basis function) model for value prediction
Example • Training data • randomly sample from prospects database; weighted to include more responders than present in actual data • Validation • rank on likelihood of response • consider top and bottom 10% -- use visualization, decision tree to understand rationale for obtained classification • Testing • sample from prospects database; unweighted with normal proportion of responders and non-responders • gains (lift) chart


![Knowledge Discovery in Data [and Data Mining] (KDD)](https://cdn2.slideserve.com/4256051/knowledge-discovery-in-data-and-data-mining-kdd-dt.jpg)